Tracking the Credibility Revolution across Fields
Paul Goldsmith-Pinkham Yale School of Management and NBER. Email: paul.goldsmith-pinkham@yale.edu. I thank Dana Scott, Pedro Sant'Anna, Nils Enevoldsen, and Esmée Zwiers for helpful comments and suggestions.
How far has the credibility revolution spread beyond applied microeconomics? I update Currie, Kleven, and Zwiers (2020) using approximately 44,000 papers—31,500 NBER working papers (1982–2025) and 12,300 articles from eleven top economics and finance journals (2011–2024)—measuring mentions of empirical methods through keyword matching. Three findings emerge. First, finance and macro/other fields differ substantially from applied micro in their mention of credibility revolution methods: as of 2024, 63 percent of applied micro papers mention experimental or quasi-experimental methods, compared to 47 percent in finance and 39 percent in macro/other. The current levels in finance and macro/other are comparable to where applied micro was in 2008–2010, though the long-run trajectories may differ. Second, growth outside applied micro is driven overwhelmingly by difference-in-differences; including DiD raises the share of finance papers mentioning any experimental or quasi-experimental method by roughly 55 percent versus 30 percent for applied micro. Other quasi-experimental methods—instrumental variables, regression discontinuity, experiments—have seen far less growth. Third, I document a striking gap between the methods studied in the Journal of Econometrics—where nonparametric estimation and asymptotic theory dominate—and those used by applied researchers, where DiD and identification strategies dominate. Published journal articles confirm these patterns are not artifacts of the NBER sample.
JEL Codes: C18, C81, B41
Keywords: Credibility revolution, difference-in-differences, text analysis, empirical methods, causal inference
Introduction
How far has the credibility revolution spread? Angrist and Pischke (2010) documented a sea change in how economists approach empirical work—a shift toward transparent research designs, explicit identification strategies, and credible causal inference. Currie, Kleven, and Zwiers (2020) showed that this shift was accelerating through the late 2010s, at least in applied microeconomics. But that analysis left open a basic question: are finance, macroeconomics, and other fields keeping pace, or has the revolution been narrower than it appears? Throughout this paper, I use "macro/other" to refer to the NBER field grouping that includes macroeconomics alongside several other programs; see Table 2 for the full composition.
I take up this question by extending Currie, Kleven, and Zwiers (2020)'s approach to a much larger corpus. Using keyword matching on the full text of approximately 44,000 economics papers—31,500 NBER working papers (1982–2025) and 12,300 articles from eleven top journals (2011–2024)—I track mentions of empirical methods across fields and over time. The expanded sample adds finance and macro/other fields, which were omitted from the original analysis, and supplements working papers with published journal articles. Because the analysis measures keyword mentions rather than verified use, the trends should be interpreted as tracking the diffusion of methodological language—a proxy for, but not identical to, actual method adoption.
The answer is clear: mentions of credibility revolution methods have spread unevenly across fields. I organize the findings around three main results.
First, finance and macro/other differ substantially from applied micro on most measures. As of 2024, 63 percent of applied micro papers mention experimental or quasi-experimental methods, compared to 47 percent in finance and 39 percent in macro/other (Table 3). In identification language, the current levels in finance and macro/other are comparable to where applied micro was in 2008–2010. The gap has shown little sign of closing.
Second, the credibility revolution outside applied micro has been—to a first approximation—a difference-in-differences revolution. Including DiD in the methods measure raises the finance share by roughly 55 percent versus 30 percent for applied micro. Other quasi-experimental tools—instrumental variables, regression discontinuity, RCTs—have seen far less growth in finance and macro. This reliance on a single method is striking given the recent econometrics literature highlighting sensitivities in DiD designs (Roth 2022; De Chaisemartin and d'Haultfoeuille 2020; Callaway, Goodman-Bacon, and Sant'Anna 2024).
Third, I document a pronounced gap between the methods studied in the Journal of Econometrics—where nonparametric estimation, bootstrap methods, and asymptotic theory dominate—and those used by applied researchers, where DiD and identification strategies are the dominant tools. The tools powering the credibility revolution and the theoretical literature developing new estimators occupy largely separate methodological spaces.
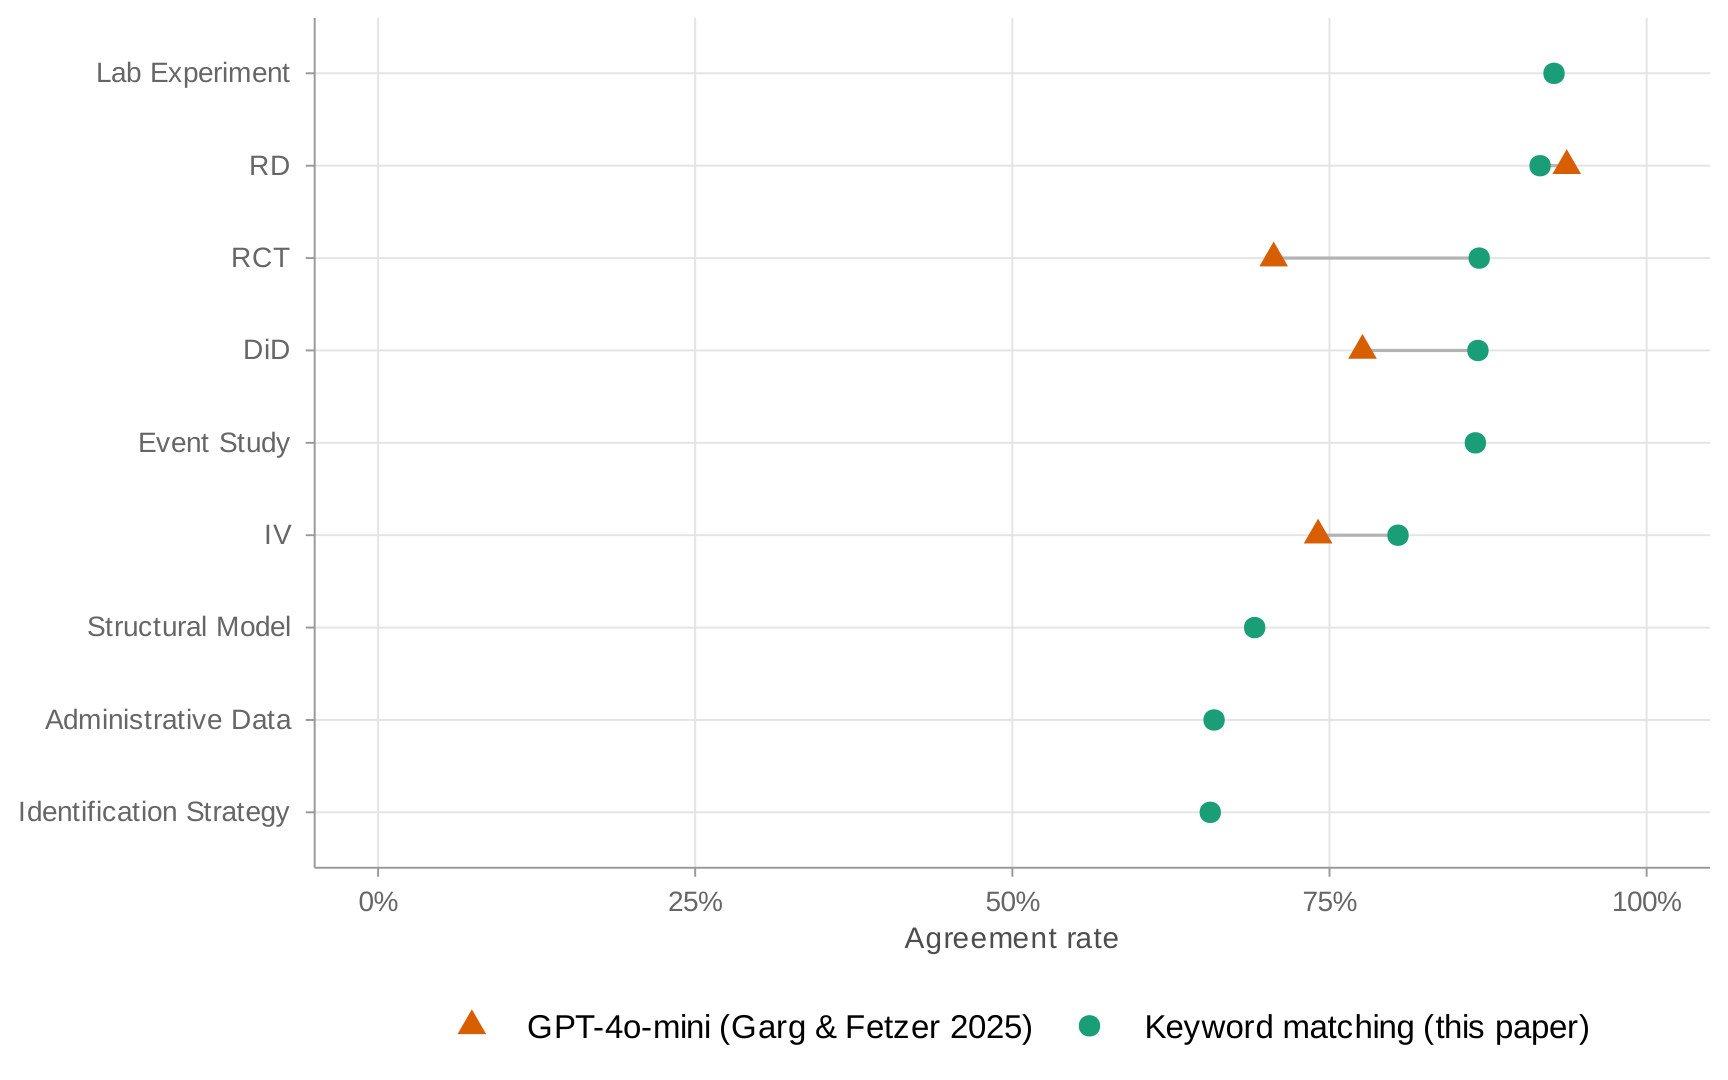
Two features of the analysis strengthen confidence in these patterns. Published articles from top journals show trends that closely mirror the NBER data, with slightly higher rates of credibility revolution methods—consistent with a publication selection effect favoring methodologically rigorous papers. And a validation exercise using LLM-based classification confirms that keyword matching achieves 80–92 percent agreement rates for most method categories with more sophisticated approaches at near-zero computational cost, though agreement is lower for broader categories like identification strategy and structural models.
The paper proceeds as follows. Section 1 describes the data and methods. Section 2 presents the NBER working paper results. Section 3 extends the analysis to published articles from top journals. Section 4 examines the gap between econometric theory and applied practice. Section 5 concludes.
1. Data and Methods
I measure mentions of empirical methods over time following the approach in Currie, Kleven, and Zwiers (2020): searching the full text of papers for keywords and regular expressions that capture the language of the credibility revolution (e.g. "threats to identification" or "identification strategy"). See the Appendix for the full set of keywords. I follow the same method as Currie, Kleven, and Zwiers (2020).
NBER Working Papers
I collect the full text of approximately 31,500 NBER working papers from the NBER website, covering papers 1000 through the most recent available (1982–2025). Unlike Currie, Kleven, and Zwiers (2020), who focus exclusively on "applied micro" papers, I include all papers in the NBER working paper series. Each paper is associated with one or more of nineteen NBER research programs, which I use for field classification.
Top Journal Articles
I supplement the NBER data with articles from eleven leading economics and finance journals, covering 2011–2024: three general-interest economics journals (AER, QJE, JPE), the four American Economic Journals (Applied, Policy, Macro, Micro), three top finance journals (Journal of Finance, Review of Financial Studies, Journal of Financial Economics), and the Journal of Econometrics. I extract full text from published PDFs using PyMuPDF. For AER, I filter out Papers and Proceedings (P&P) articles using DOI patterns. I exclude the Review of Economic Studies (zero text extraction coverage) and Econometrica (near-zero text coverage for 2011–2014, partial thereafter) from the main analysis; Appendix: Coverage documents text extraction rates by journal and year. In total, the journal sample comprises approximately 12,300 articles.
Text Processing
For each paper, I extract the full text, strip out the references section—identified by looking for section headers followed by high concentrations of "Journal" mentions—and apply the keyword search. I use the same keywords and regular expressions as Currie, Kleven, and Zwiers (2020), with appropriate case sensitivity for each category. The full list is in the Appendix.
Validation
I validate keyword matching against two external benchmarks. First, I compare keyword flags to the hand-coded method labels in Brodeur, Cook, and Heyes (2020), matching 357 papers across nine journals (2011–2020) by title. Treating Brodeur et al.'s labels as ground truth, keywords achieve high recall—99% for DiD and IV, 95% for RD—meaning they rarely miss a paper that uses a given method. Precision is lower (69–74% for DiD, IV, and RD), reflecting that keywords also flag papers that mention a method without using it as a primary research design. Second, I classify a stratified sample of 750 papers using two independent LLMs (Claude Haiku 4.5 and Qwen 3.5-122B). Both LLMs produce nearly identical positive rates for every method category, and agreement with keywords runs 80–92% for most categories. Full results appear in Appendix: Validation.
Field Classification
For journal articles, I classify papers into fields using a two-step procedure. First, field-specific journals are directly classified: AEJ Applied and AEJ Policy map to "Applied Micro," AEJ Macro to "Macro," AEJ Micro to "Micro Theory," the three finance journals (JF, JFE, RFS) to "Finance," and the Journal of Econometrics to "Econometrics." Second, for the general-interest journals (AER, QJE, JPE), I use JEL codes when available. Each paper's JEL code first letters determine its field: D, J, L, H, I, Q, R, or K codes map to "Applied Micro"; G codes to "Finance"; E or F codes to "Macro"; and C codes to "Econometrics." When a paper has JEL codes spanning multiple fields, I assign it to the first matching field in the priority order listed above. Papers without JEL codes—primarily from QJE and JPE, which do not report them—default to "General Econ."
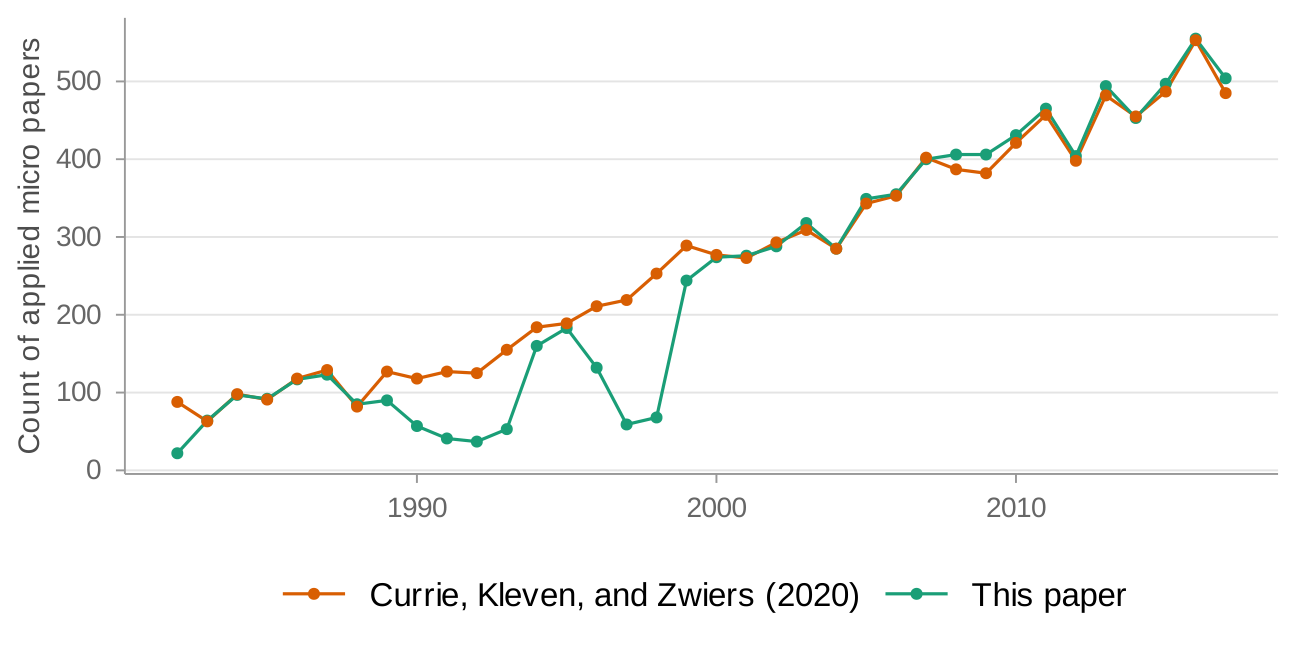
(a) Comparison of sample size to Currie, Kleven, and Zwiers (2020) in "applied micro"
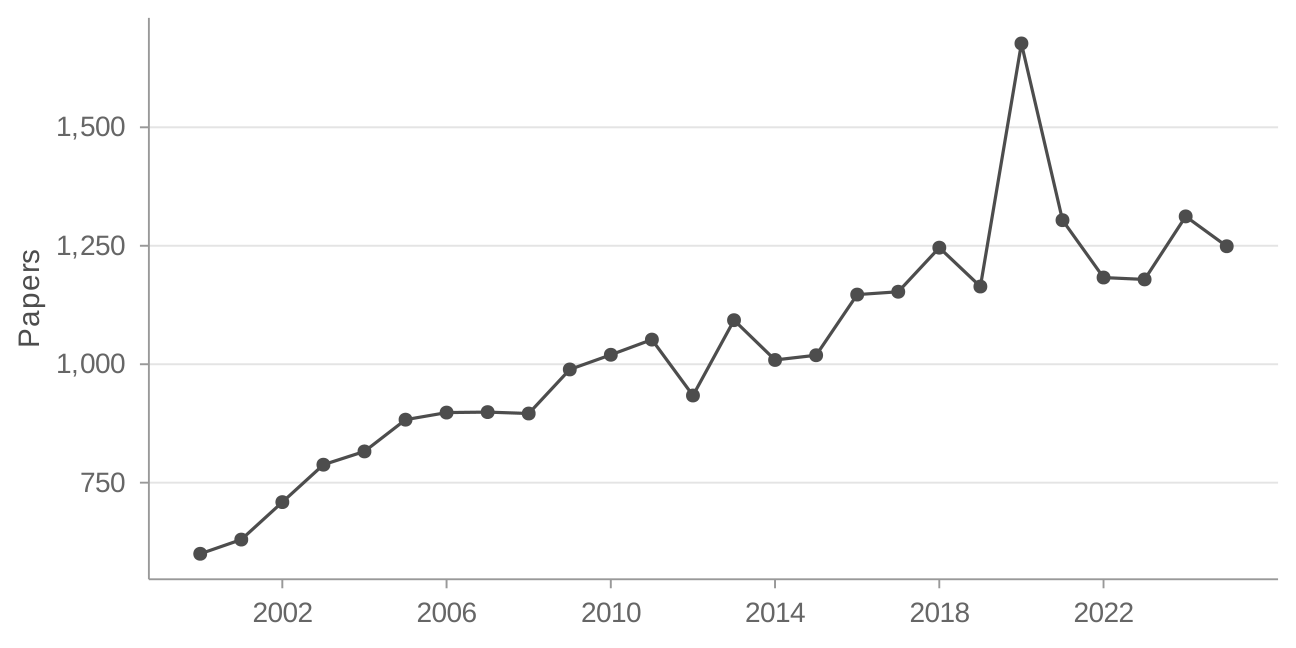
(b) Total papers in final sample over time
As Currie, Kleven, and Zwiers (2020) note in their replication package (Currie, Kleven, and Zwiers 2020b), PDF-to-text conversion introduces errors. To see how this affects my sample, I compare paper counts over time in the "applied micro" setting to Currie, Kleven, and Zwiers (2020) in Figure 1. My sample has more gaps in the 1990s—reflecting data processing errors for PDFs in that period—but coverage is close in the early 1980s and from 1999 onwards. Figure 2 provides a more direct check: I compare two headline estimates from Currie, Kleven, and Zwiers (2020) to mine. My estimates track well except in the late 1990s. I therefore focus on 2000 onwards for all results, leaving a sample of 24,702 papers.
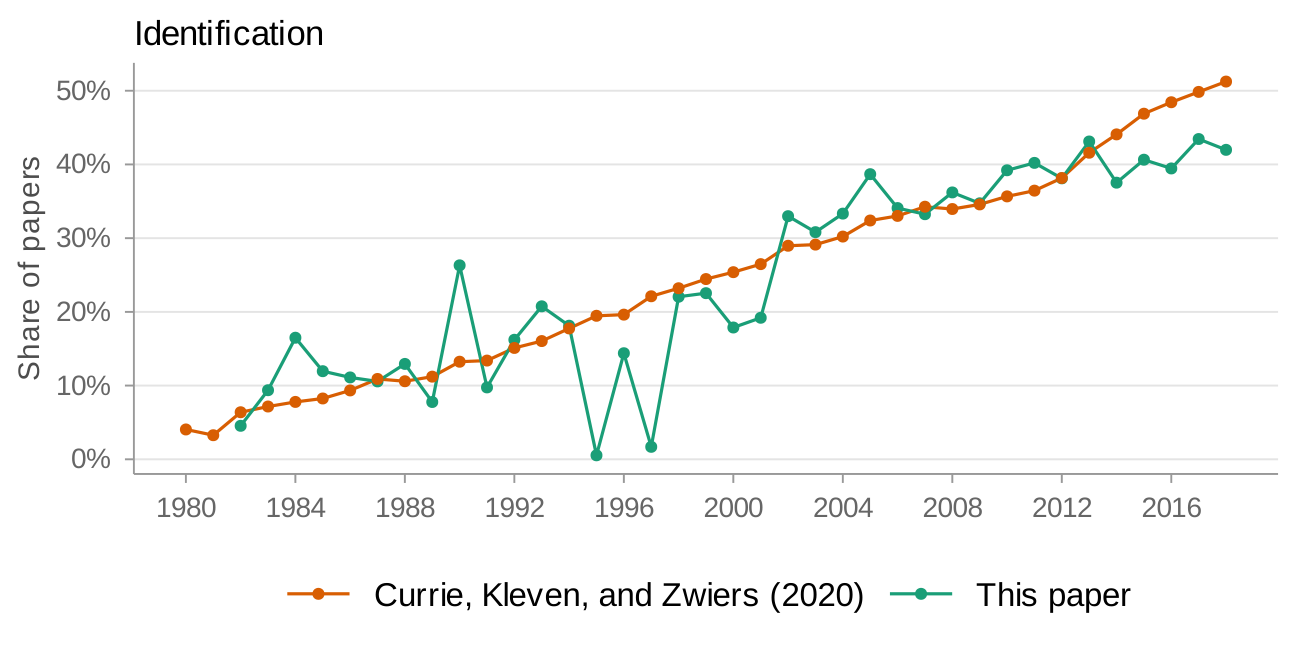
(a) Comparison of identification measure to Currie, Kleven, and Zwiers (2020) in "applied micro"
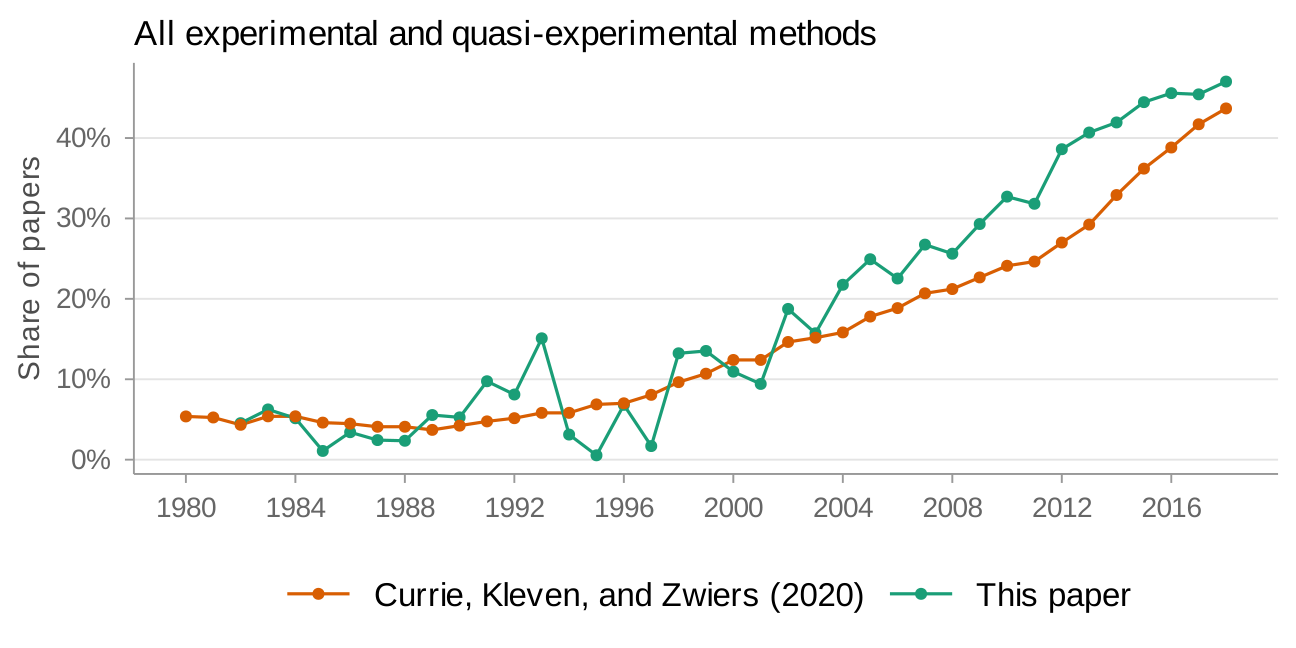
(b) Comparison of all experimental and quasi-experimental measure to Currie, Kleven, and Zwiers (2020) in "applied micro"
Each NBER working paper can be submitted to one or more of nineteen programs, and 55 percent list more than one. 45 percent have one program, 32 percent have two, 15 percent have three, 5 percent have four, and 2 percent have five. Table 1 reports the breakdown. The three largest programs are Economic Fluctuations and Growth (macroeconomics), Public Economics (applied micro), and Labor Studies (also applied micro).
| NBER Program | Number of Papers |
|---|---|
| Applied Micro | |
| Labor Studies | 5,970 |
| Public Economics | 5,896 |
| Economics of Health | 3,641 |
| International Trade and Investment | 2,466 |
| Children and Families | 2,193 |
| Industrial Organization | 2,160 |
| Economics of Education | 2,105 |
| Development Economics | 1,955 |
| Political Economy | 1,869 |
| Environment and Energy Economics | 1,724 |
| Economics of Aging | 1,698 |
| Finance | |
| Asset Pricing | 2,985 |
| Corporate Finance | 2,785 |
| Macro/Others | |
| Economic Fluctuations and Growth | 5,645 |
| International Finance and Macroeconomics | 3,107 |
| Monetary Economics | 2,924 |
| Productivity, Innovation, and Entrepreneurship | 2,785 |
| Development of the American Economy | 1,675 |
| Law and Economics | 1,385 |
To compare across programs, I extend Currie, Kleven, and Zwiers (2020)'s classification. I define "finance" as Asset Pricing and Corporate Finance, and "macro/other" as the remaining programs. Table 2 defines these groupings.
| Field Group | Number of Papers |
|---|---|
| Applied Micro | 18,288 |
| Macro/Others | 5,111 |
| Finance | 1,758 |
| Finance + Macro/Others | 1,692 |
Throughout the analysis, field and program labels are non-exclusive: a paper contributes to every program to which it is submitted. I focus on 2000 onwards for most results, leaving a sample of approximately 24,700 NBER papers. Table 3 provides a snapshot of the headline numbers.
| Field | 2016–2024 | 2000–2015 | ||||||||
|---|---|---|---|---|---|---|---|---|---|---|
| $N$ | Ident. | Exp./QE | DiD | Excl. DiD | $N$ | Ident. | Exp./QE | DiD | Excl. DiD | |
| Applied Micro | 8,265 | 40.2% | 58.3% | 25.3% | 45.8% | 9,067 | 33.4% | 42.9% | 11.8% | 37.1% |
| Finance | 586 | 22.7% | 35.8% | 19.8% | 23.2% | 1,121 | 15.1% | 22.5% | 10.9% | 14.2% |
| Macro/Others | 2,514 | 25.1% | 29.7% | 12.5% | 21.8% | 4,047 | 17.6% | 22.0% | 6.3% | 17.7% |
2. Results from NBER Working Papers
Overall trends
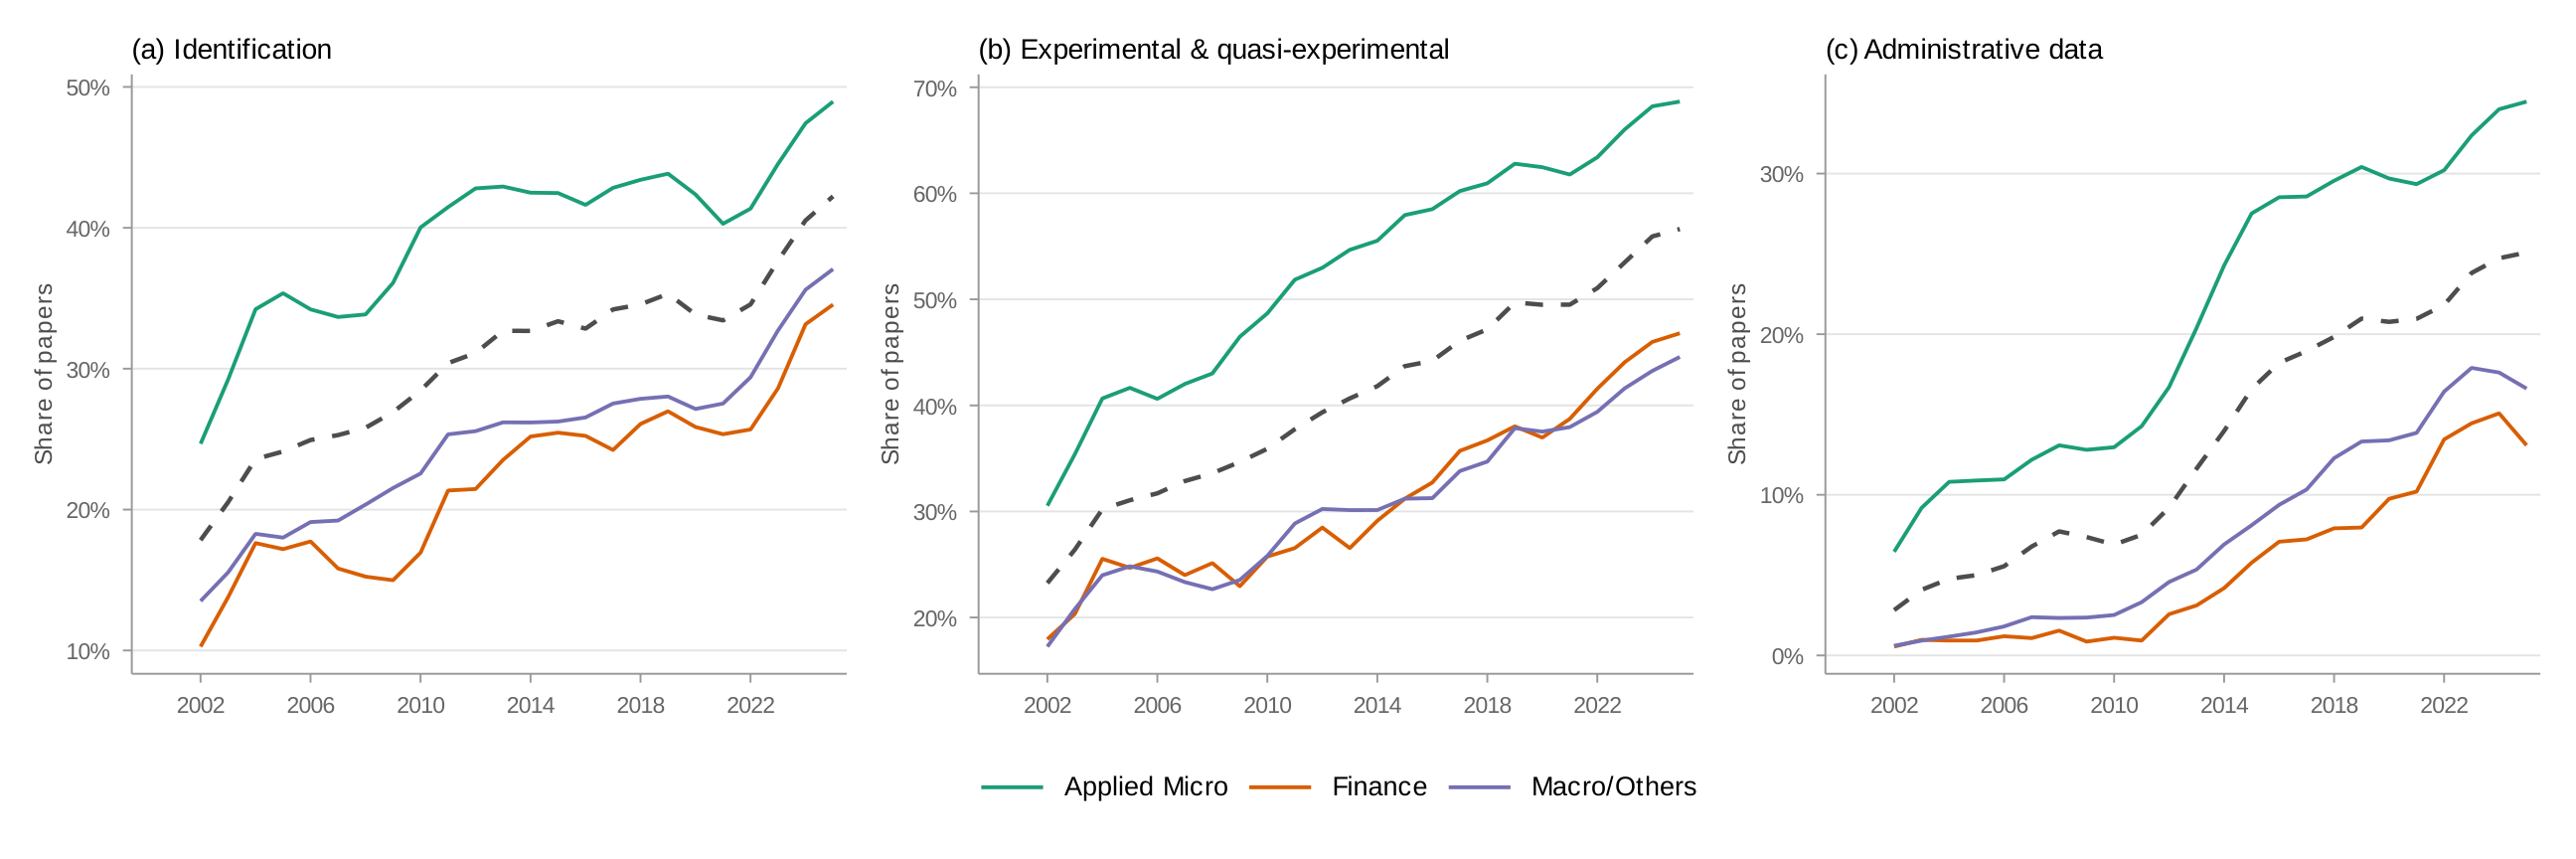
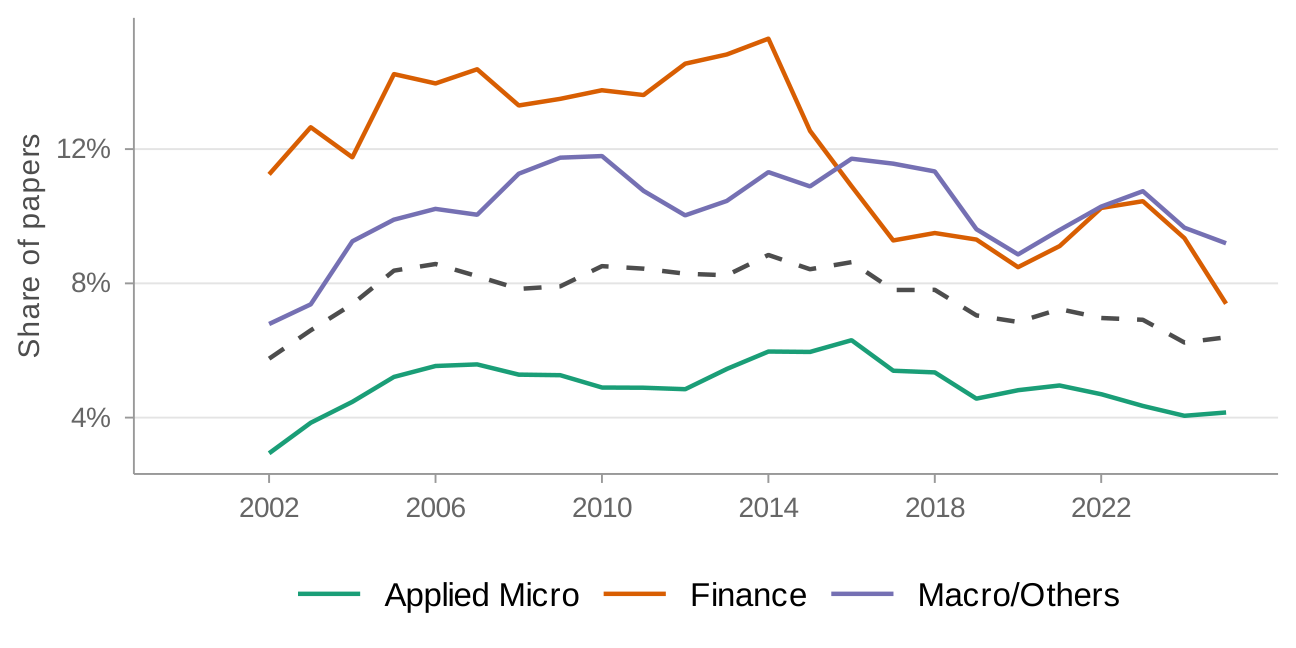
Figure 3 presents the updated version of Currie, Kleven, and Zwiers (2020)'s Figure 2, now covering all NBER papers through May 2024. Currie, Kleven, and Zwiers (2020) use a five-year moving average; I present two-year moving averages throughout. Each panel shows field-specific trends as colored lines, with the overall aggregate as a dashed black line.
Nearly all trends continue in the direction Currie, Kleven, and Zwiers (2020) documented. The share of papers explicitly mentioning identification has risen overall, with growth slowing markedly since 2016 (panel a). The share mentioning any experimental or quasi-experimental method, by contrast, has continued to rise even after 2016 (panel b). This means identification language has saturated while mentions of specific methods keep growing. Administrative data (panel c) has also continued its upward trend.
But the aggregate trends mask substantial heterogeneity. Figure 3 previews the paper's central finding: mentions of credibility revolution methods have spread unevenly, with persistent gaps between applied micro on the one hand and finance and macro/other on the other.
Comparison across fields
Figure 3 splits each variable by the three field groupings. The gaps are large and persistent. For identification, experimental and quasi-experimental methods, and administrative data, applied micro is well above both finance and macro/other. Applied micro's identification share has grown more slowly since 2017, reaching 46 percent by 2024, and remains 13–17 percentage points above finance and macro/other. For experimental and quasi-experimental methods, applied micro reaches 63 percent by 2024, while finance stands at 47 percent and macro/other at 39 percent (Table 3).
To put these gaps in context, it helps to ask where finance and macro/other stand today relative to applied micro in the past. In identification, the current levels in finance and macro/other are comparable to where applied micro was in 2008–2010. In experimental and quasi-experimental methods, finance is comparable to applied micro circa 2011–2012 and macro/other to applied micro circa 2008. Whether this reflects a lag that will eventually close or different long-run equilibria is an important open question.
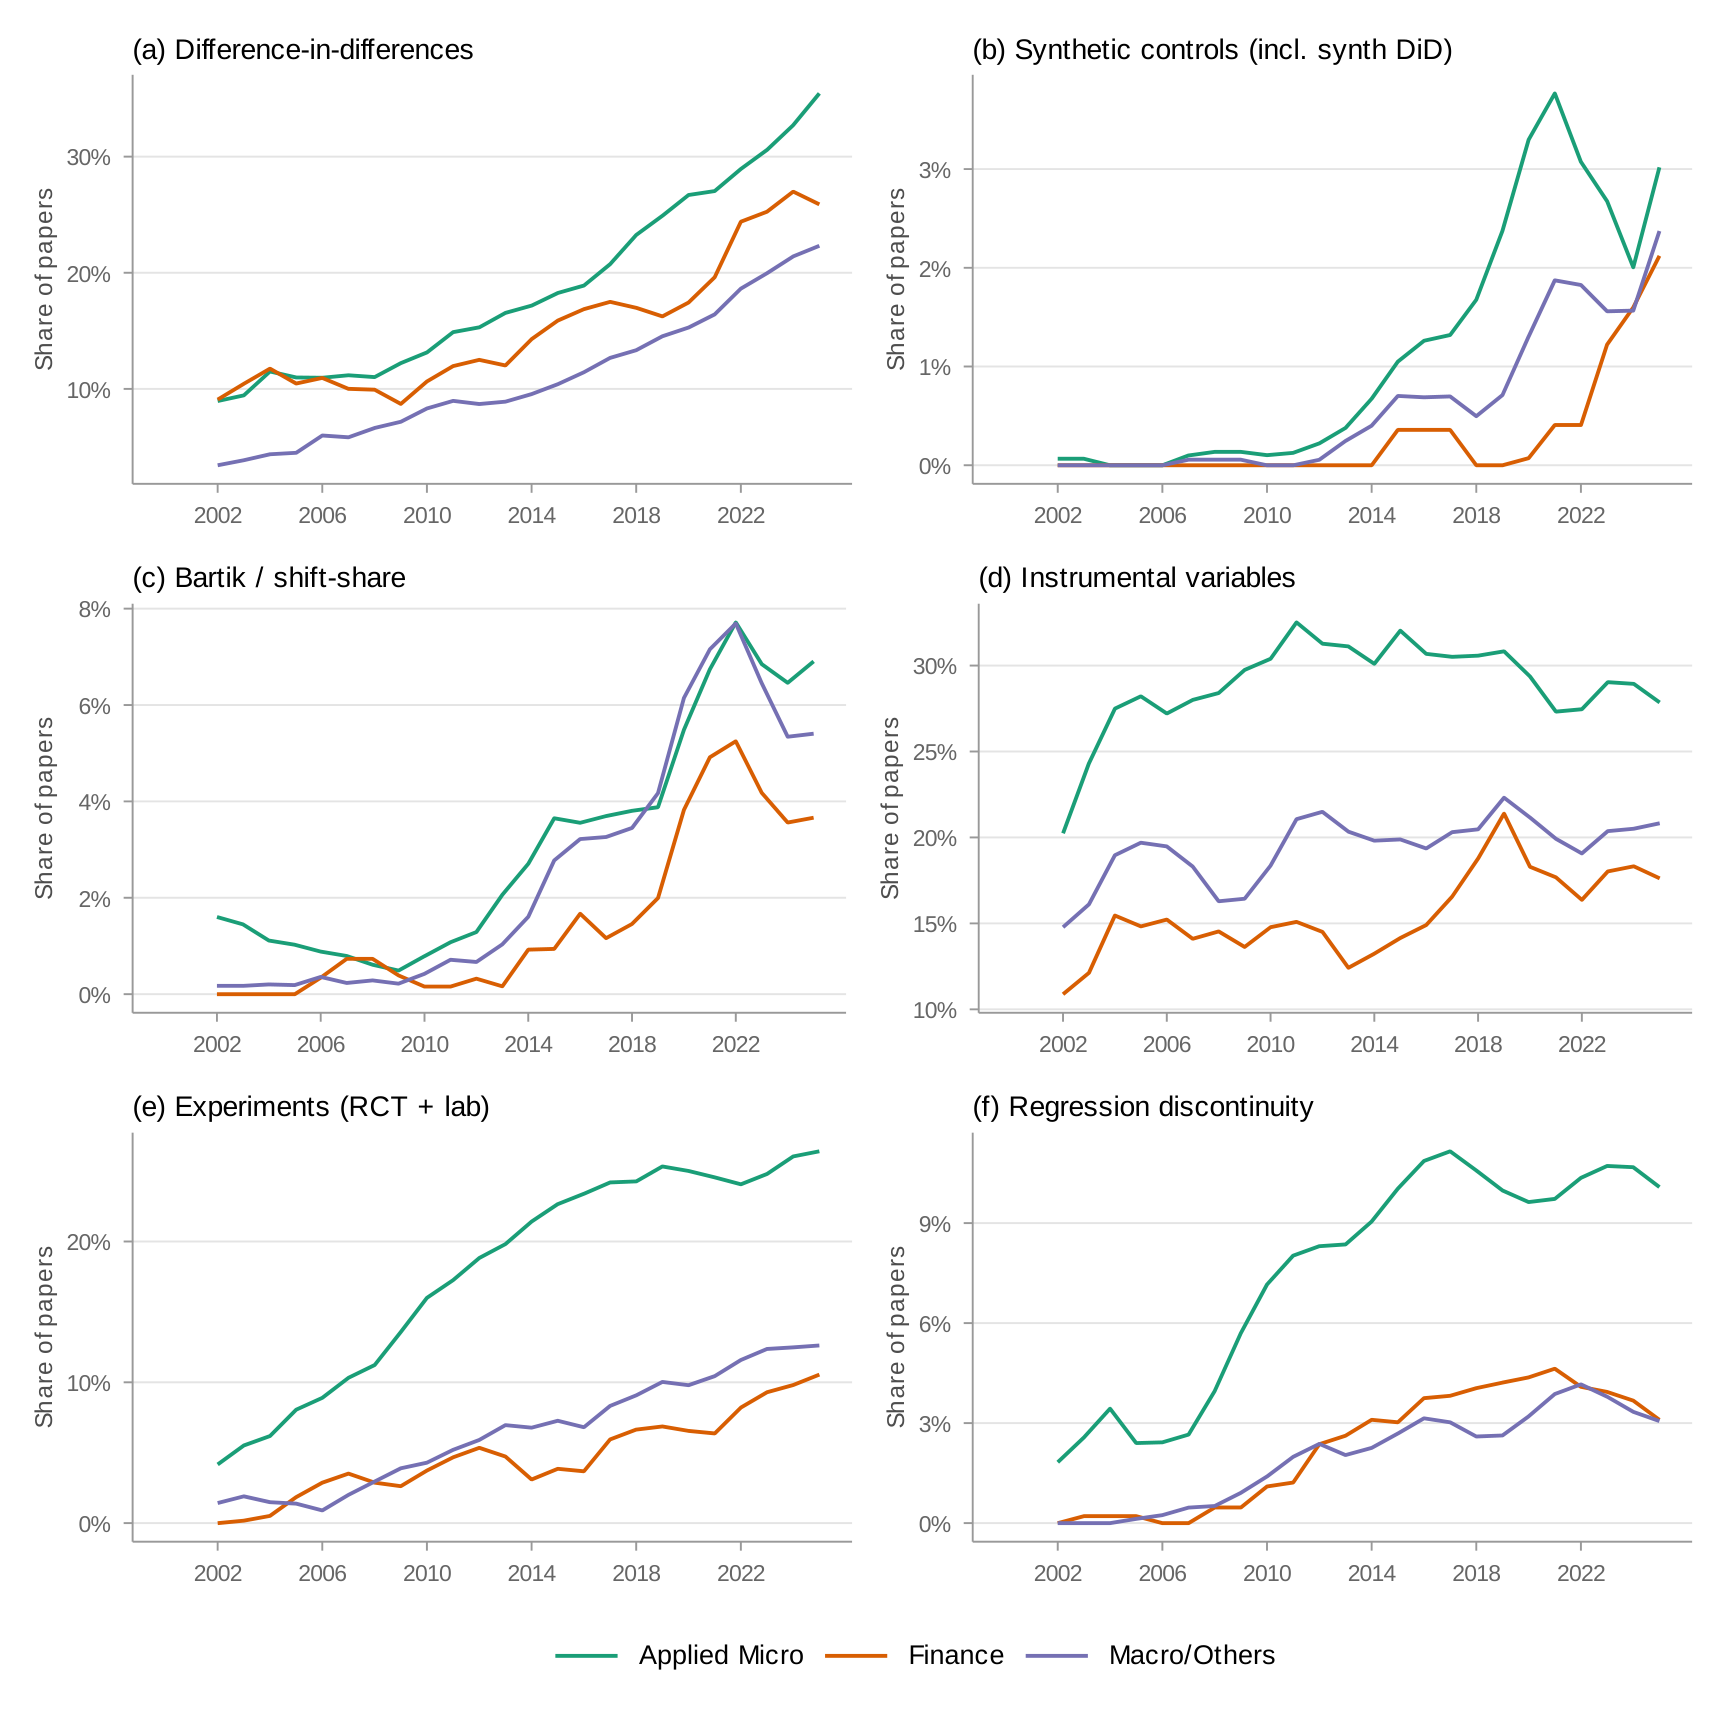
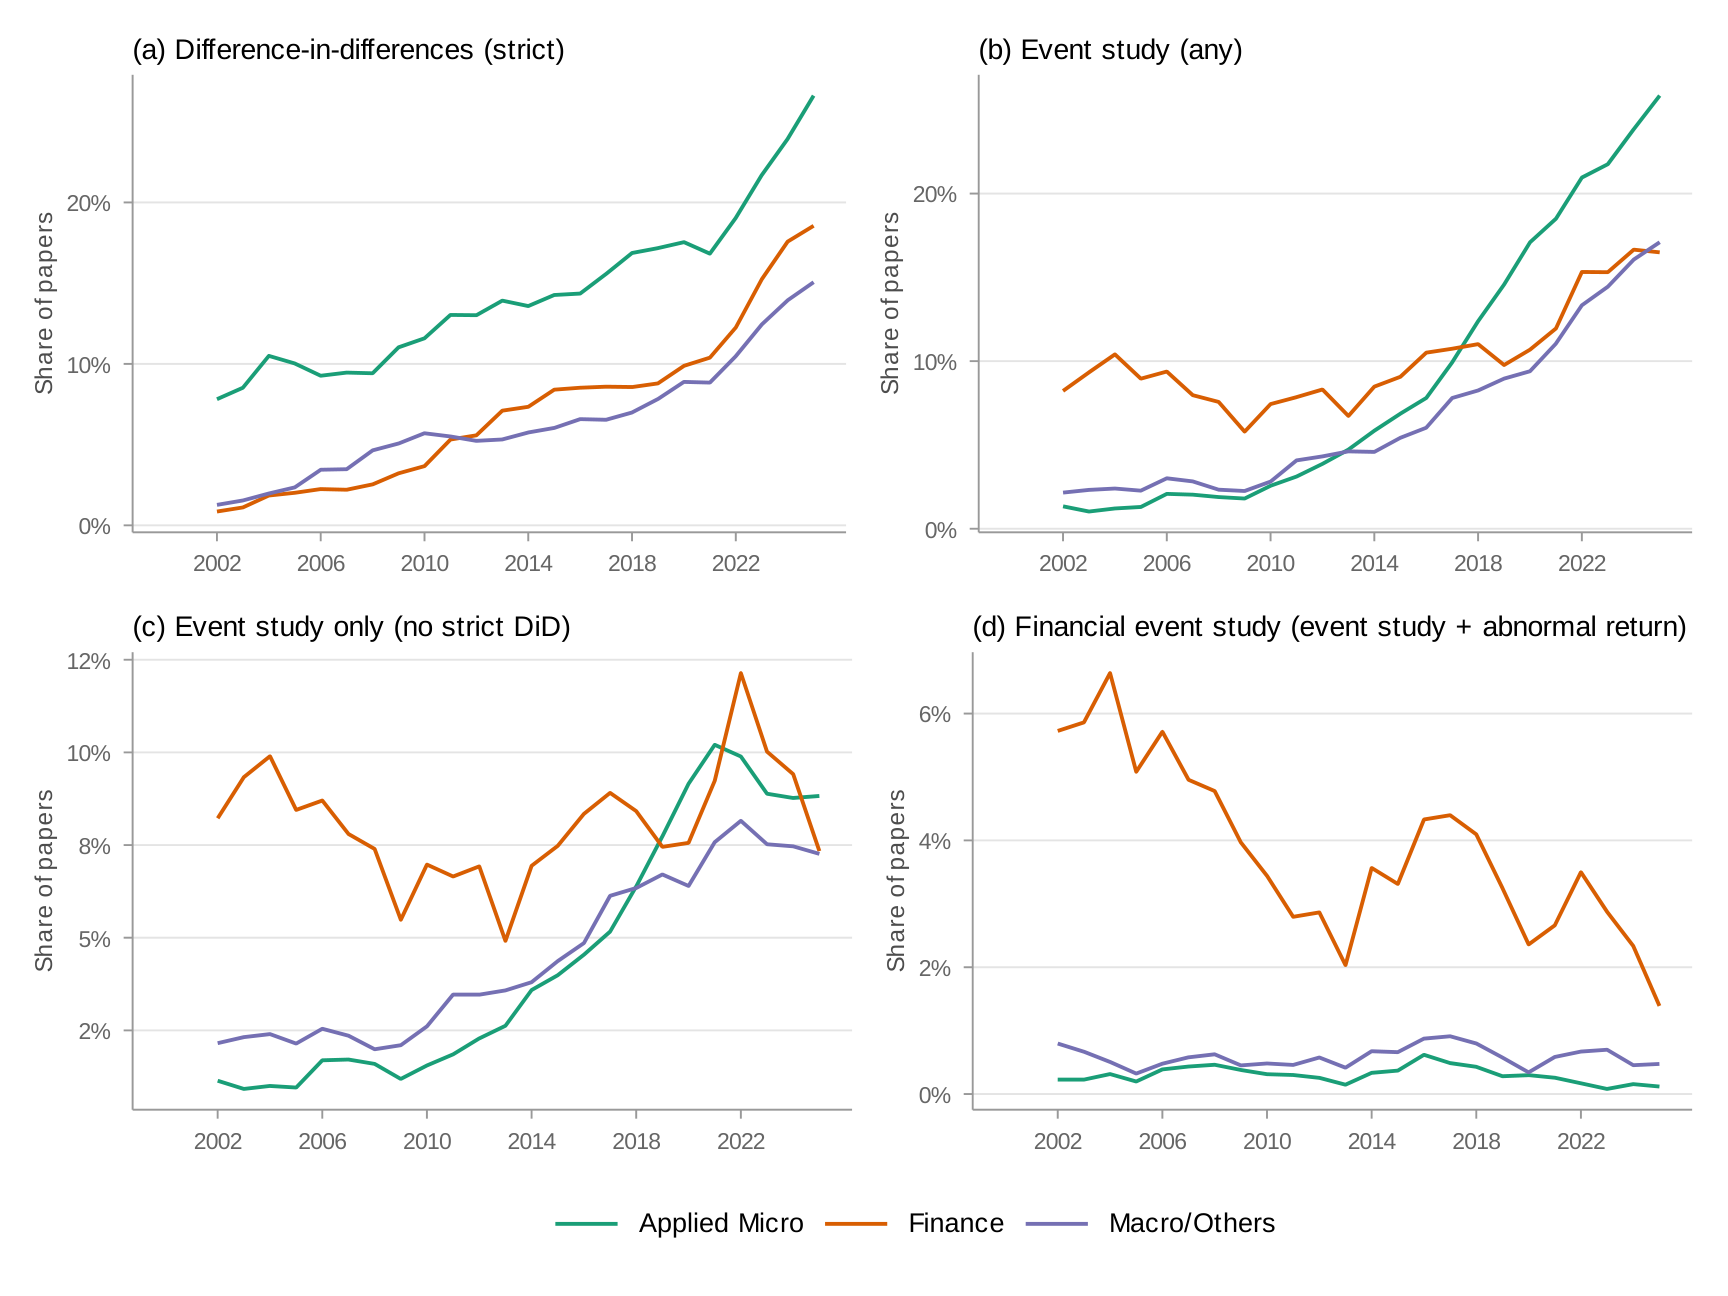
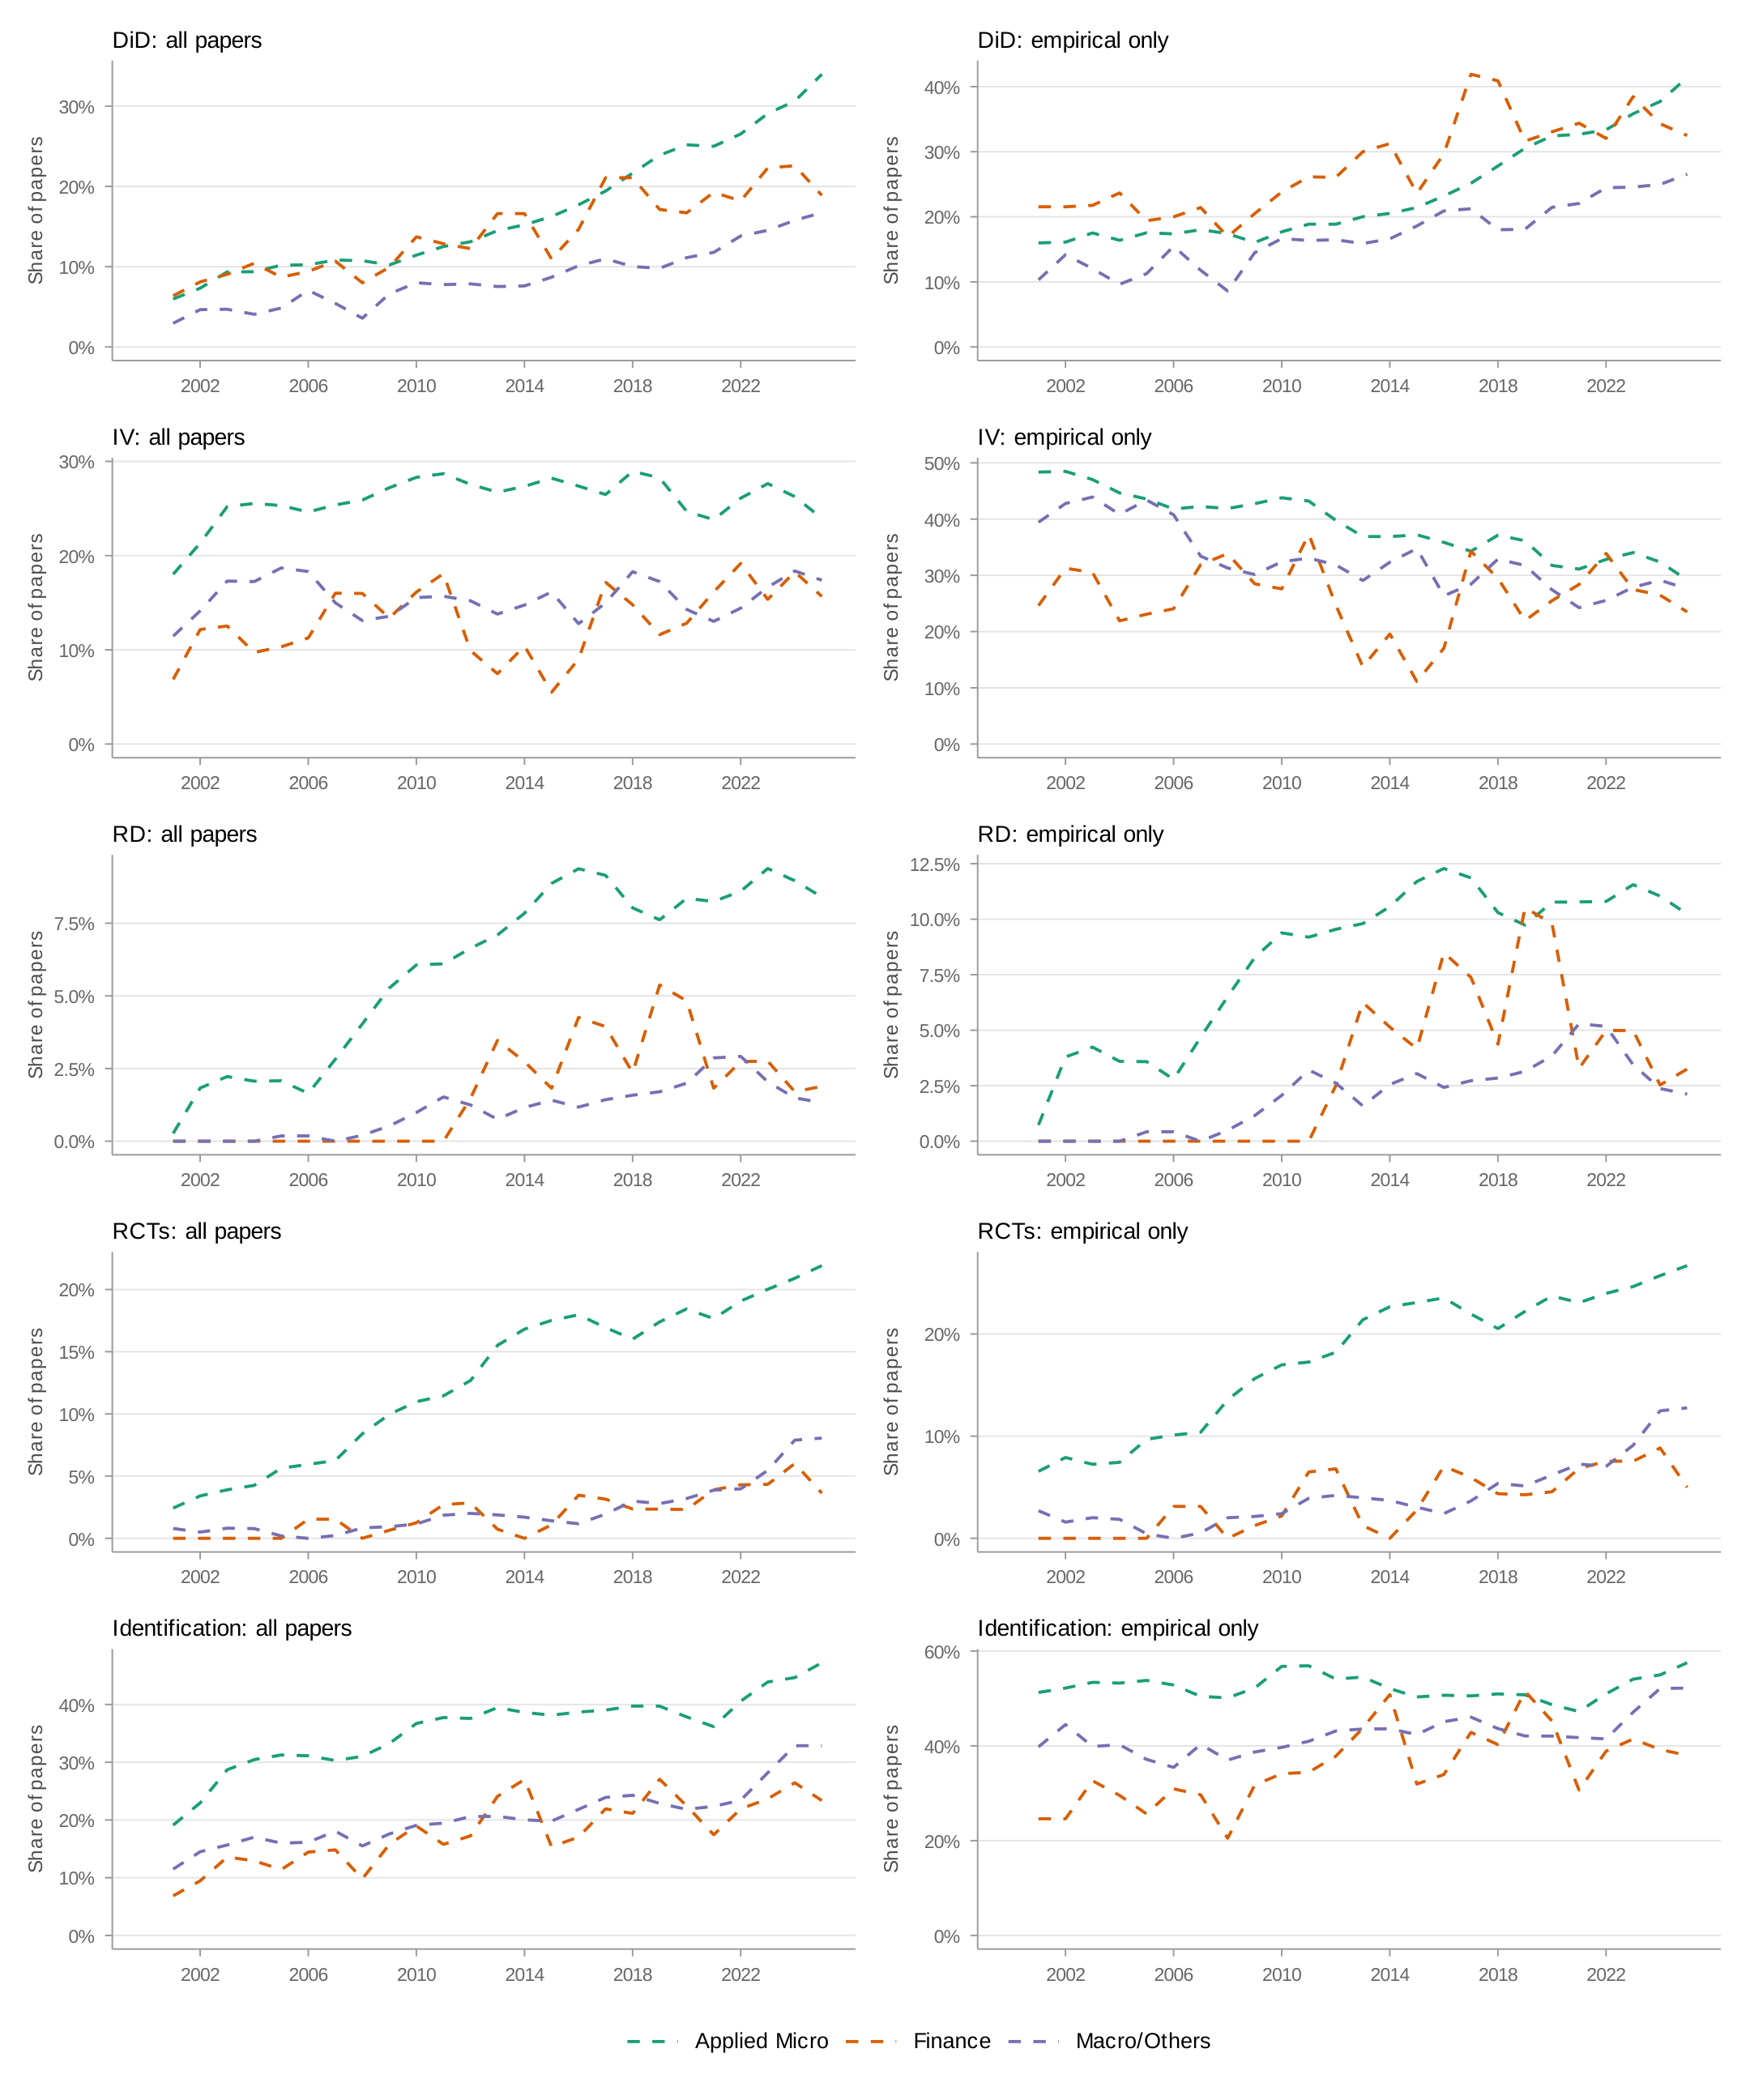
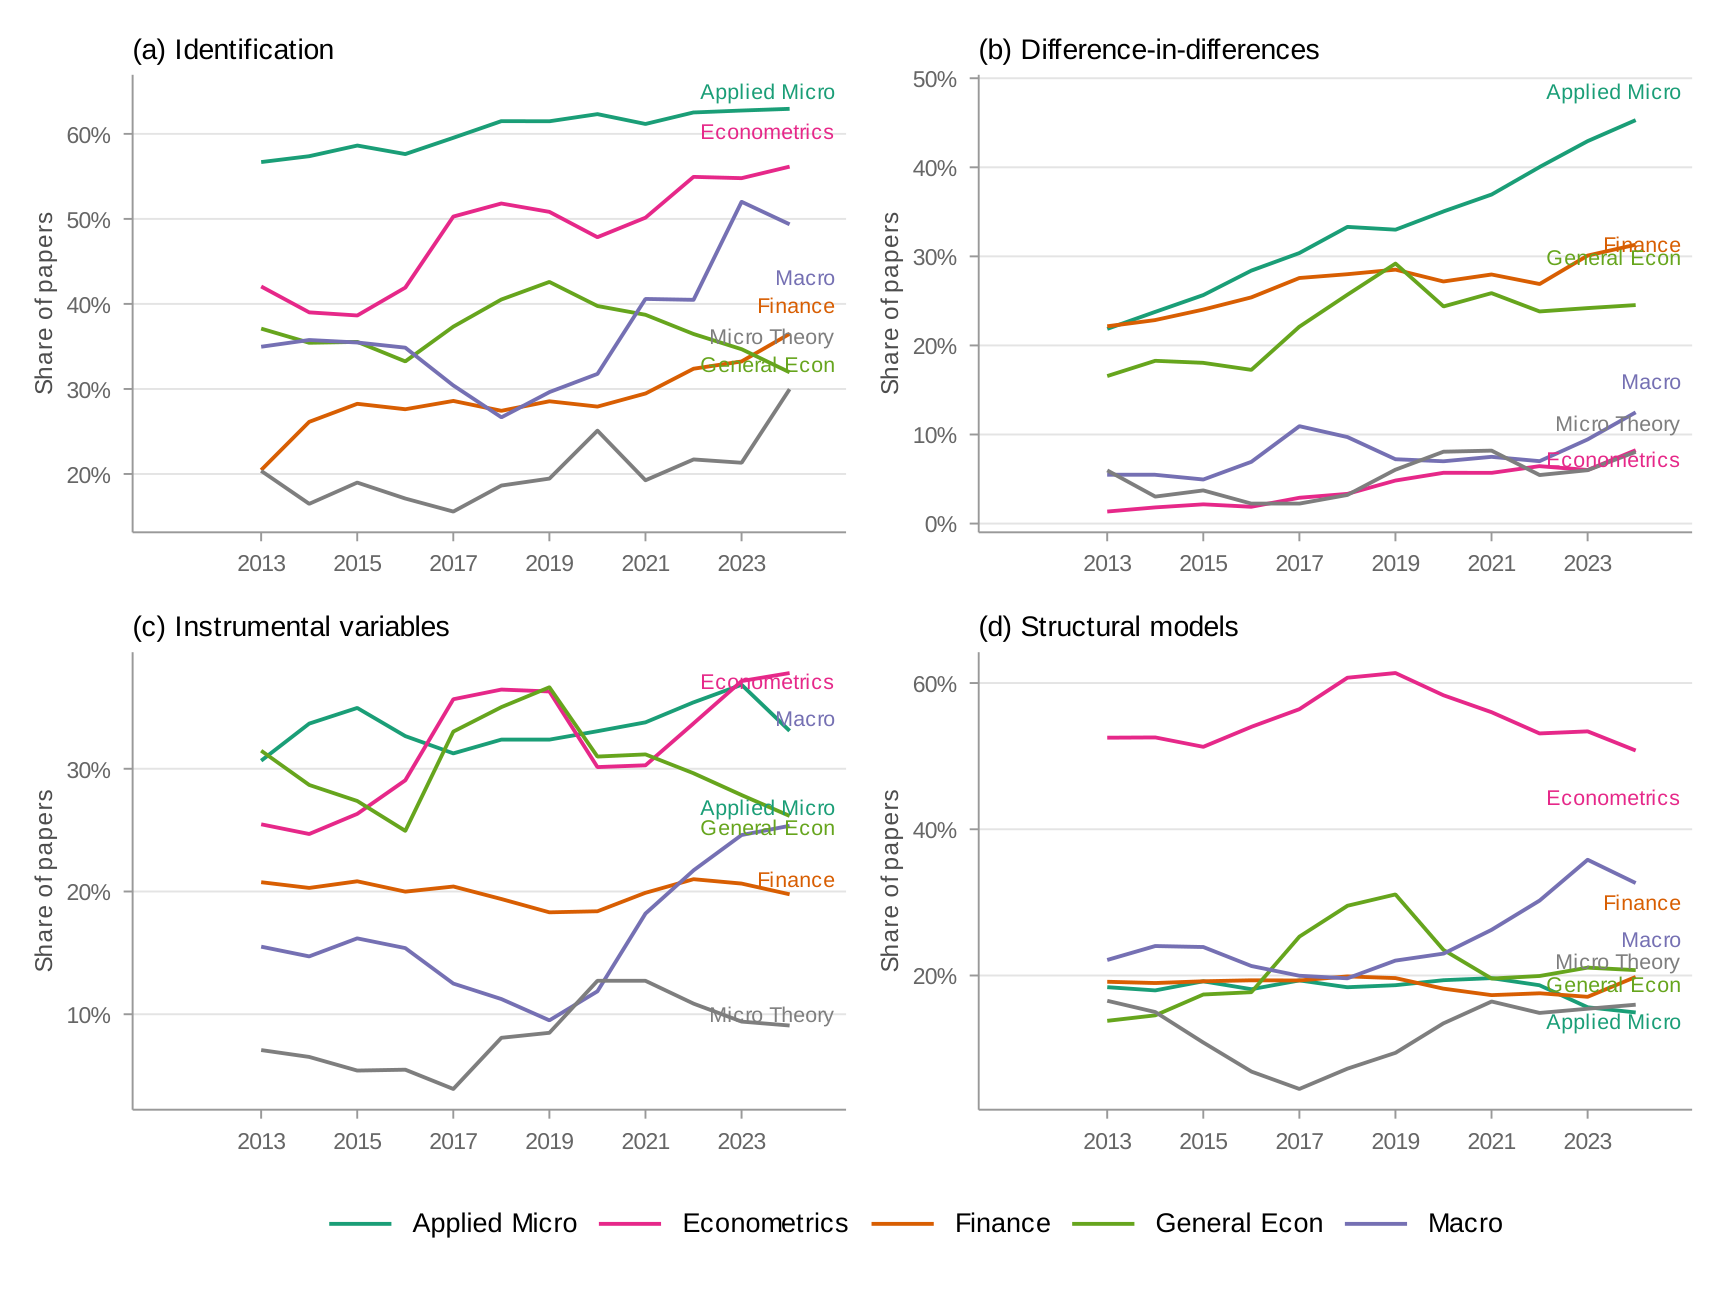
Figure 4 presents method-specific trends by field. I start with difference-in-differences (panel a), which includes event studies. All three fields show steep growth, with applied micro leading. Finance is close behind—partly because the term "event study" captures financial event studies (abnormal return studies) that differ methodologically from DiD-style event studies. Appendix: DiD Decomposition decomposes this measure.
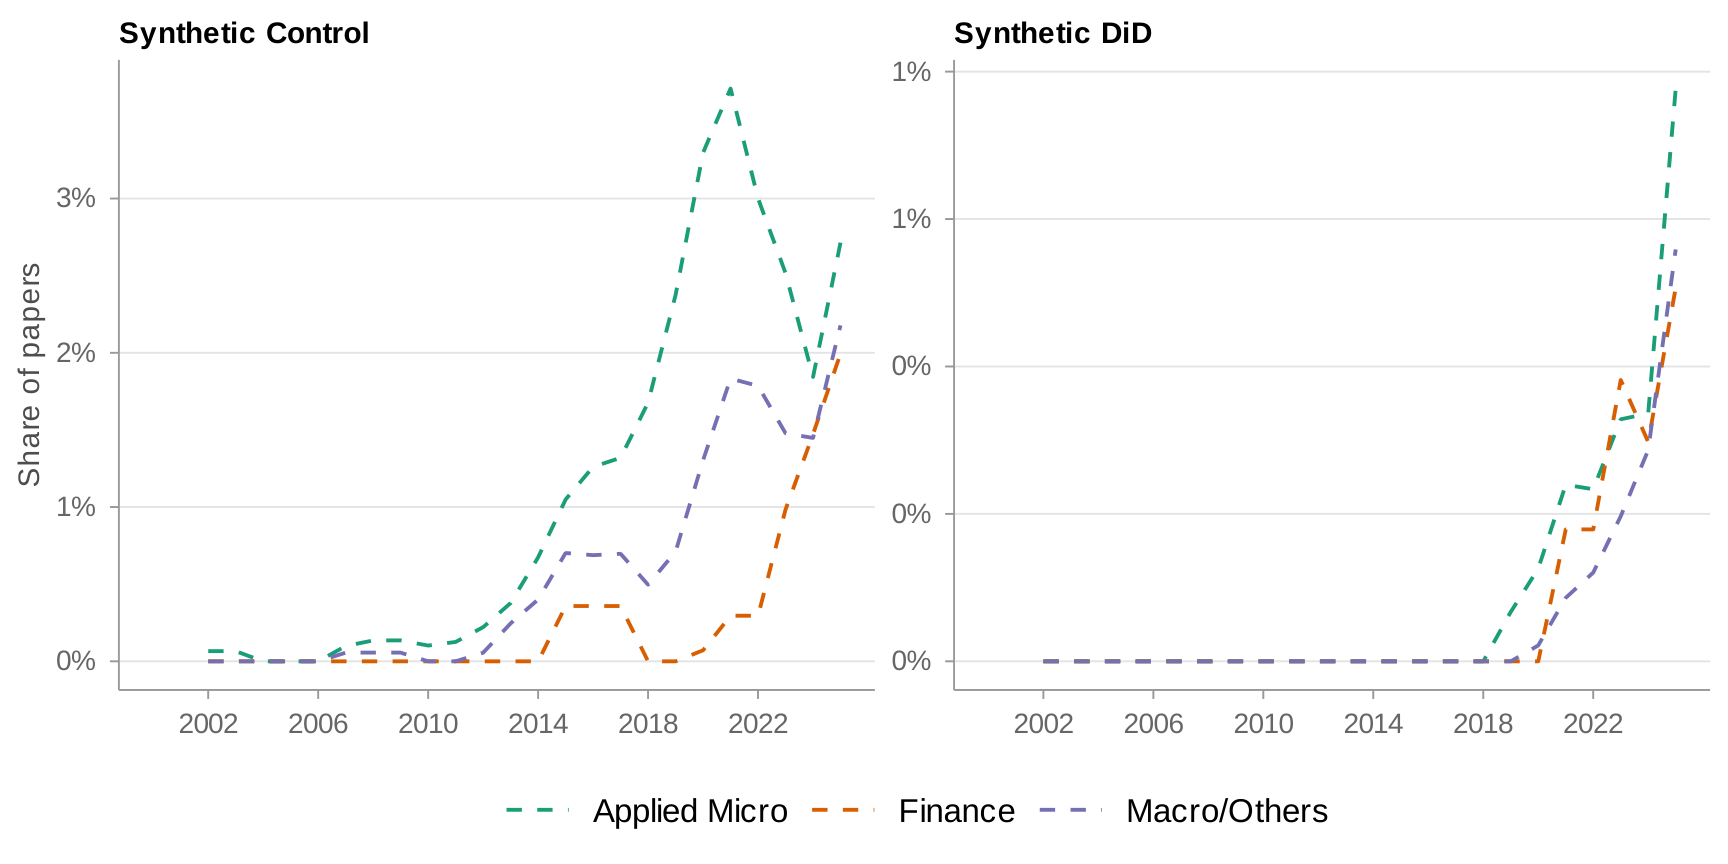
Panel (b) tells a different story: synthetic controls. Growth continued through 2020 but has since leveled off. Panel (c) examines Bartik and shift-share instruments (Goldsmith-Pinkham, Sorkin, and Swift 2020; Borusyak, Hull, and Jaravel 2022; Adão, Kolesár, and Morales 2019). Since 2013, this method has grown rapidly across all fields. Panel (d) plots the share mentioning instrumental variables, which has stayed roughly constant over time. In panel (e), applied micro leads in RCT mentions, with 20 percent of papers by 2024. In panel (f), applied micro leads finance and macro/other by about 7–8 percentage points in regression discontinuity mentions, but the share has flattened across all fields over the past eight years.
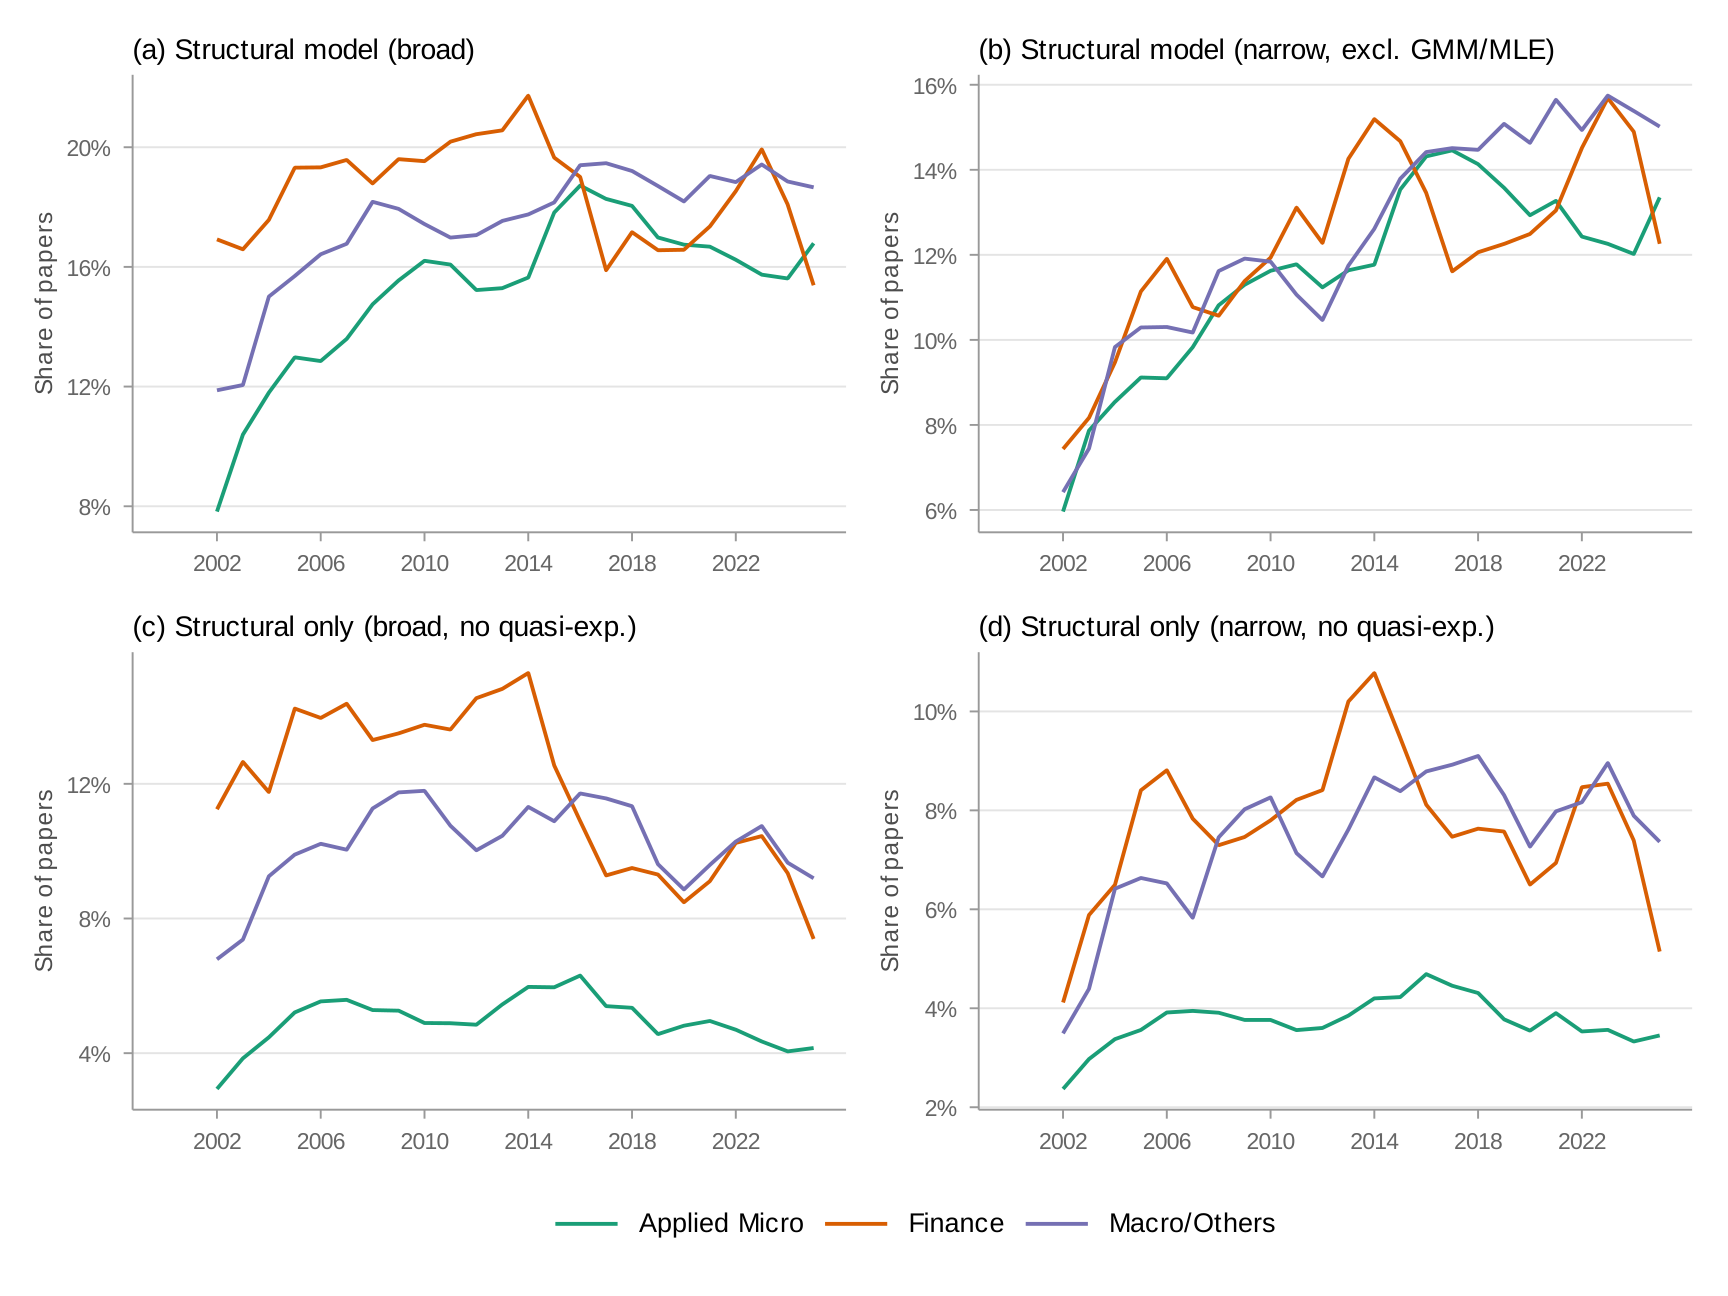
What accounts for the gap between applied micro and the other fields? One possibility is structural estimation. In Figure 5, macro/other and finance have a 7.5–10 percentage point higher share of structural estimation mentions. More revealing is panel (b), which isolates papers that mention structural estimation without also mentioning experimental or quasi-experimental methods. Here the gap widens: finance and macro/other papers are roughly twice as likely to fall in this category as applied micro papers. This means that when applied micro papers use structural models, they typically pair them with complementary research designs—a pattern far less common in finance and macro.
(a) Structural Models
(b) Structural Models without mention of experimental or quasi-experimental methods
Breakdown across programs
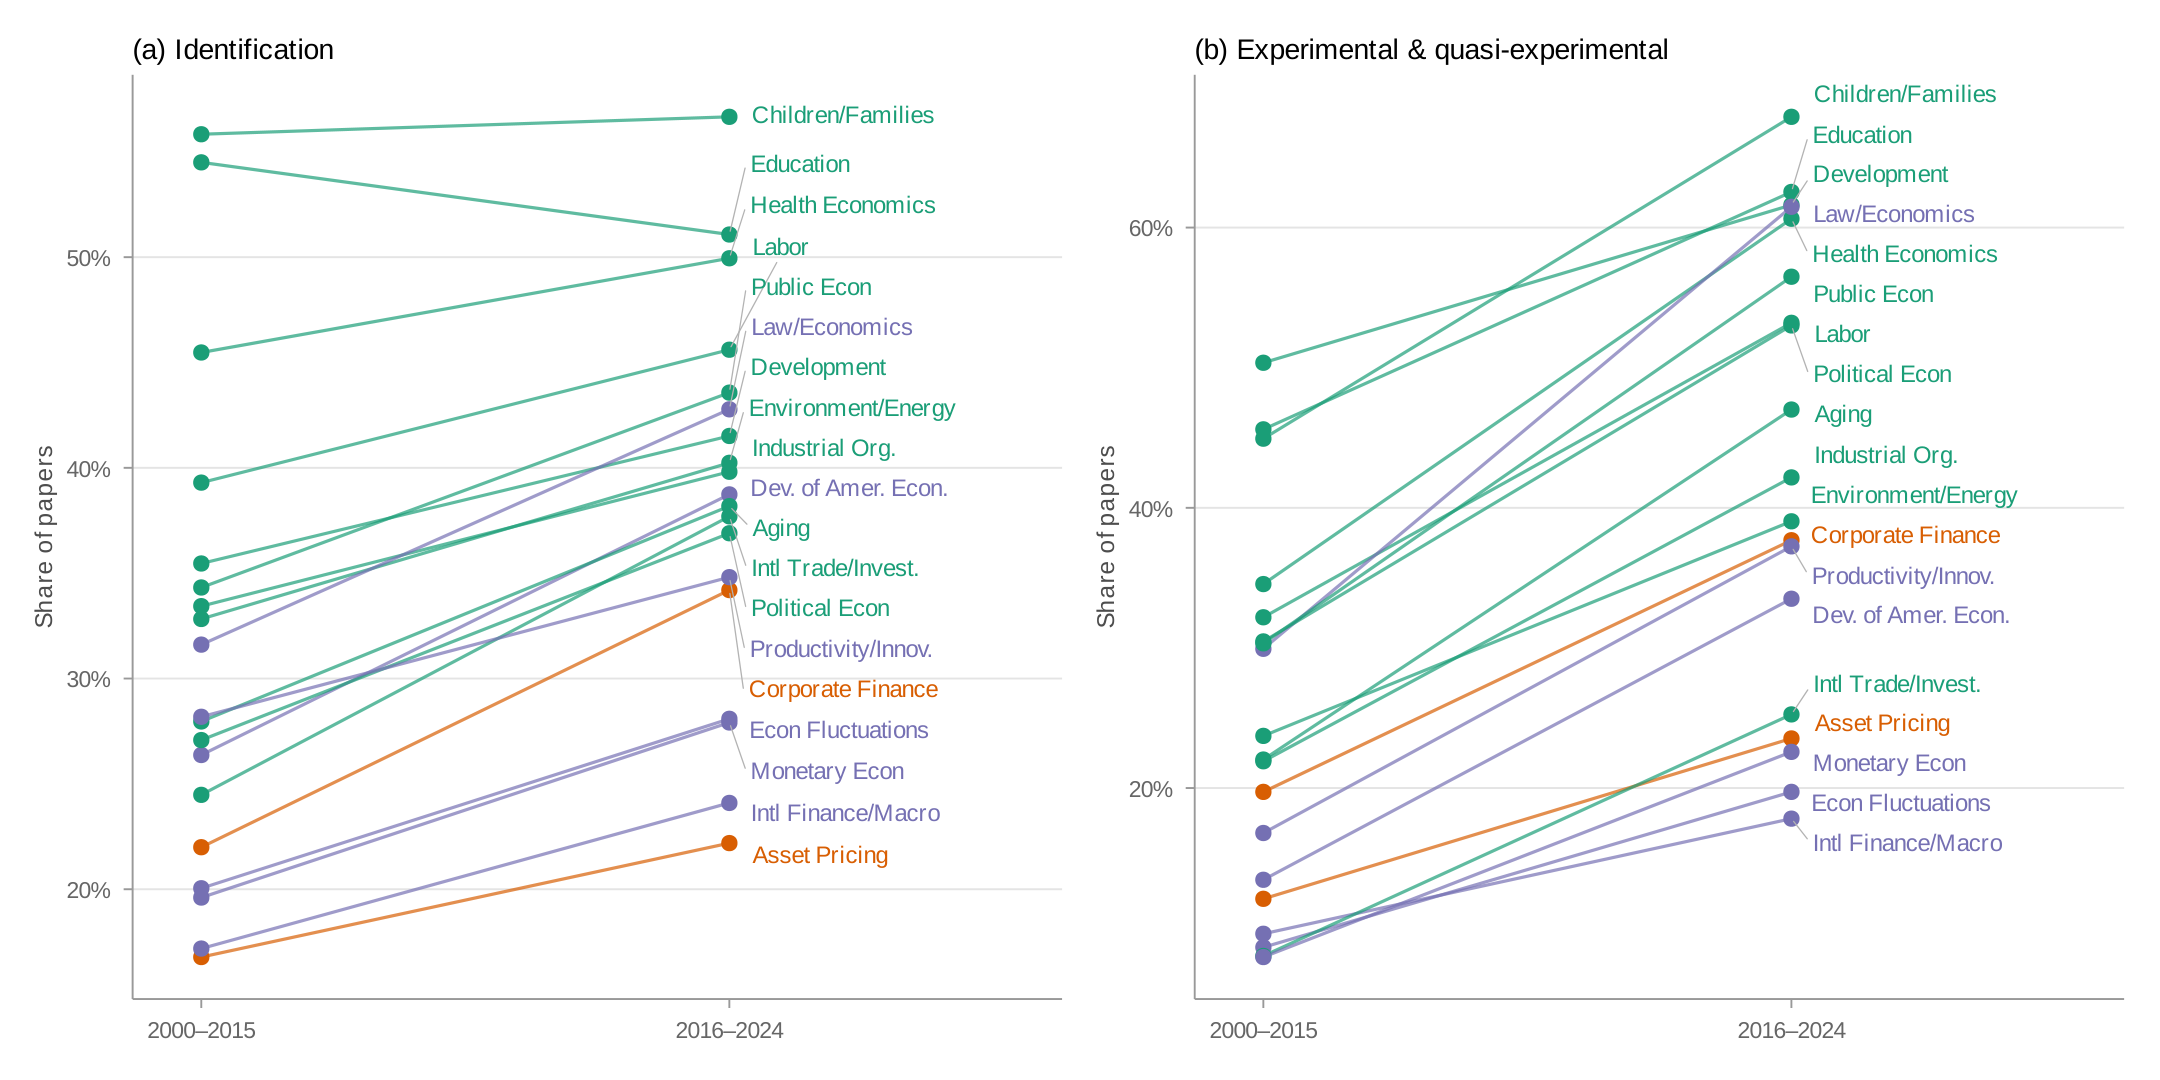
The field-level averages mask important within-field variation. Figure 6 plots the share of papers mentioning identification and experimental/quasi-experimental methods across all nineteen programs using slope charts. Each line segment connects a program's 2000–2015 share (left) to its 2016–2024 share (right), colored by field.
Despite within-field heterogeneity, the cross-field pattern is strikingly consistent. Applied micro programs have higher identification shares than nearly all finance and macro/other programs, with the exceptions of Productivity, Innovation, and Entrepreneurship and Law and Economics. Within finance, there is a large gap between Asset Pricing and Corporate Finance.
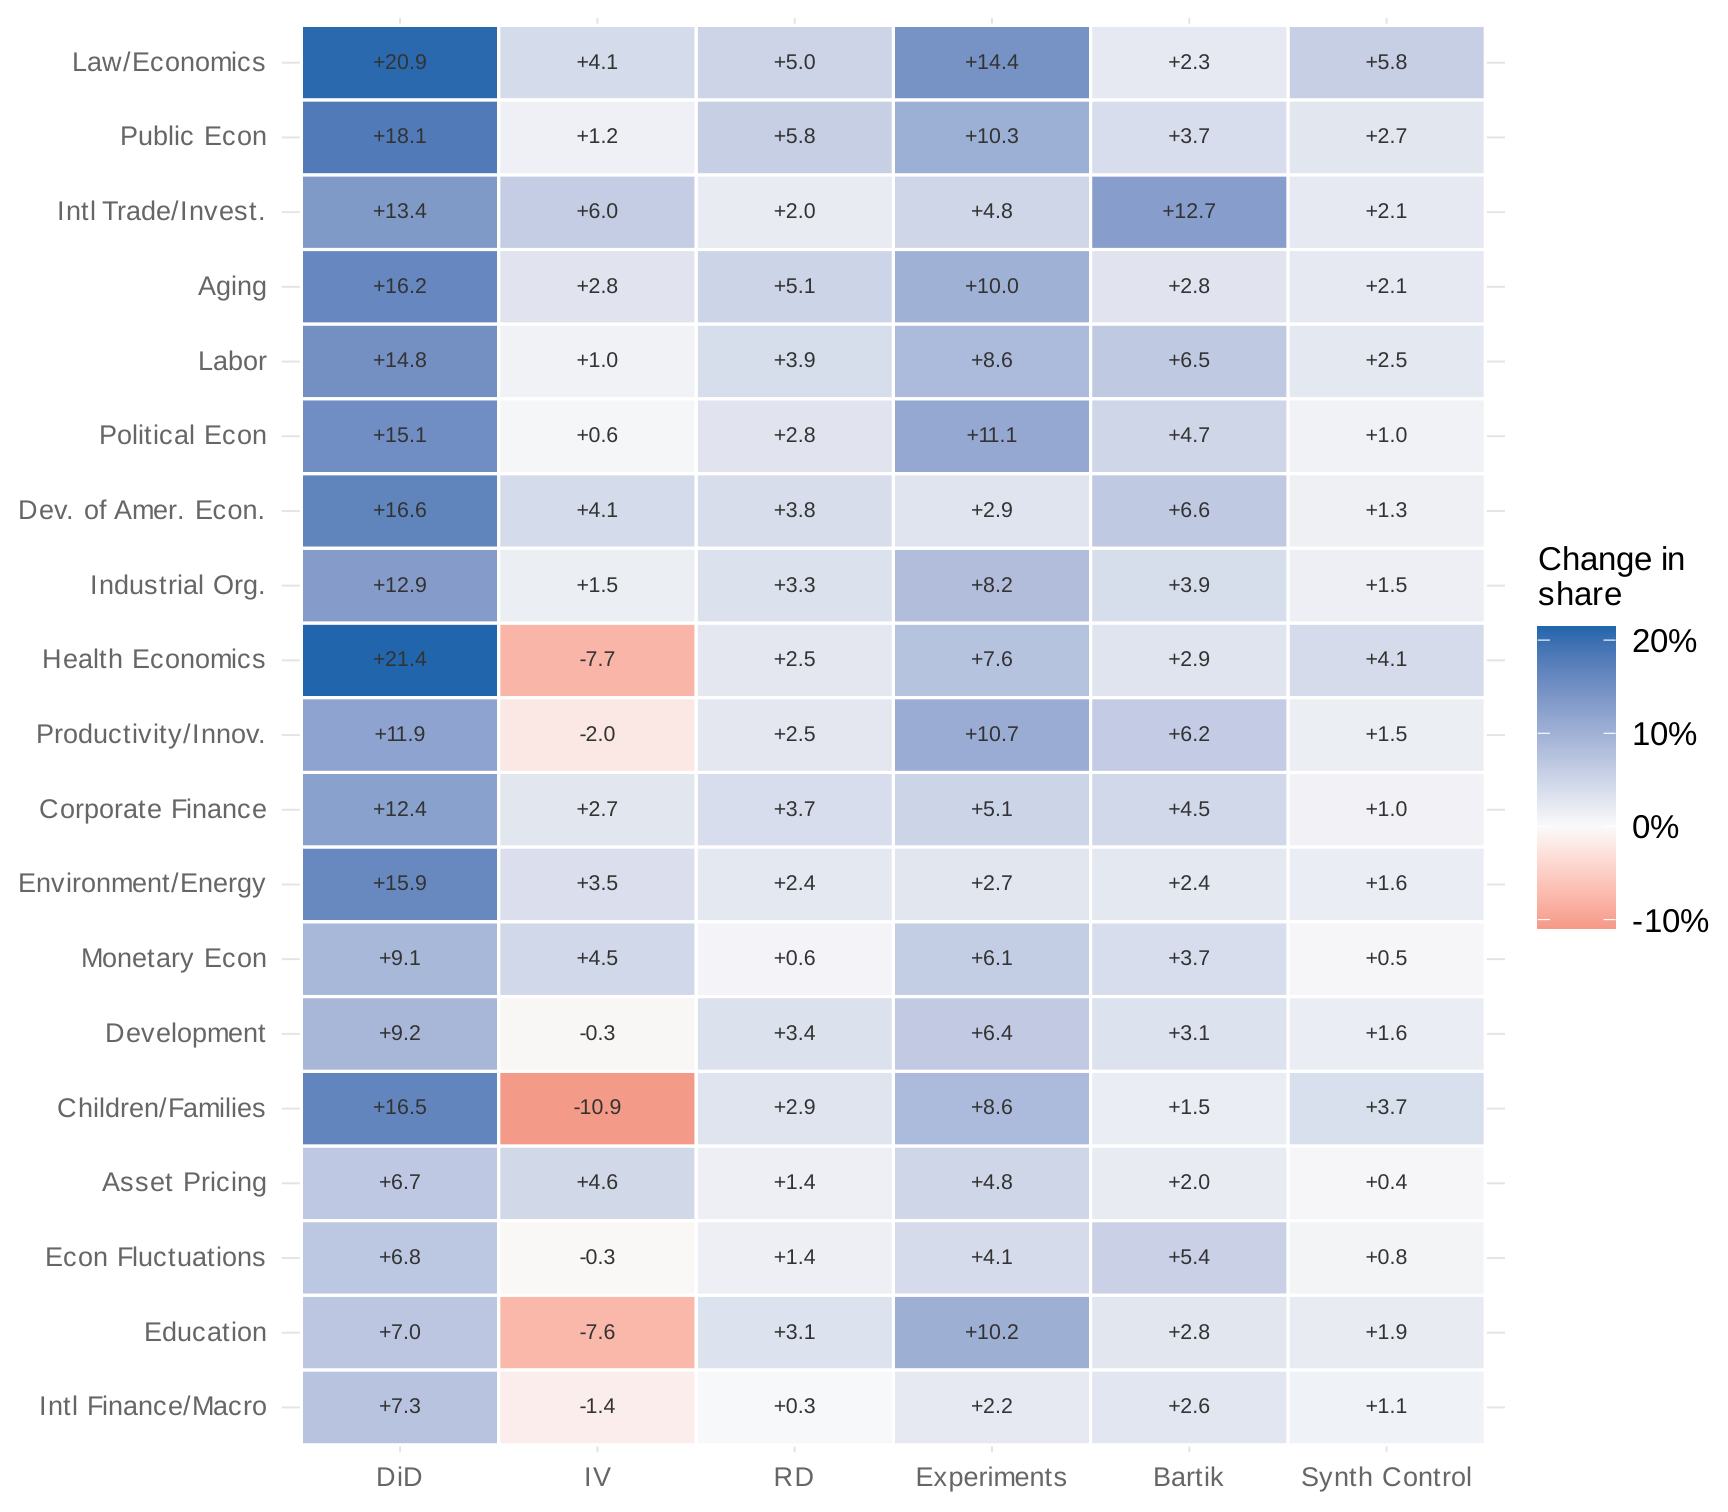
Which methods have driven the growth? Figure 7 presents a heatmap of the change in method share by program between 2000–2015 and 2016–2024. The answer is unambiguous: DiD accounts for most of the growth across programs. The share mentioning instrumental variables has stayed roughly constant. Regression discontinuity has risen only slightly. The credibility revolution in finance and macro has been, to a first approximation, a difference-in-differences revolution.
The dominance of difference-in-differences across fields
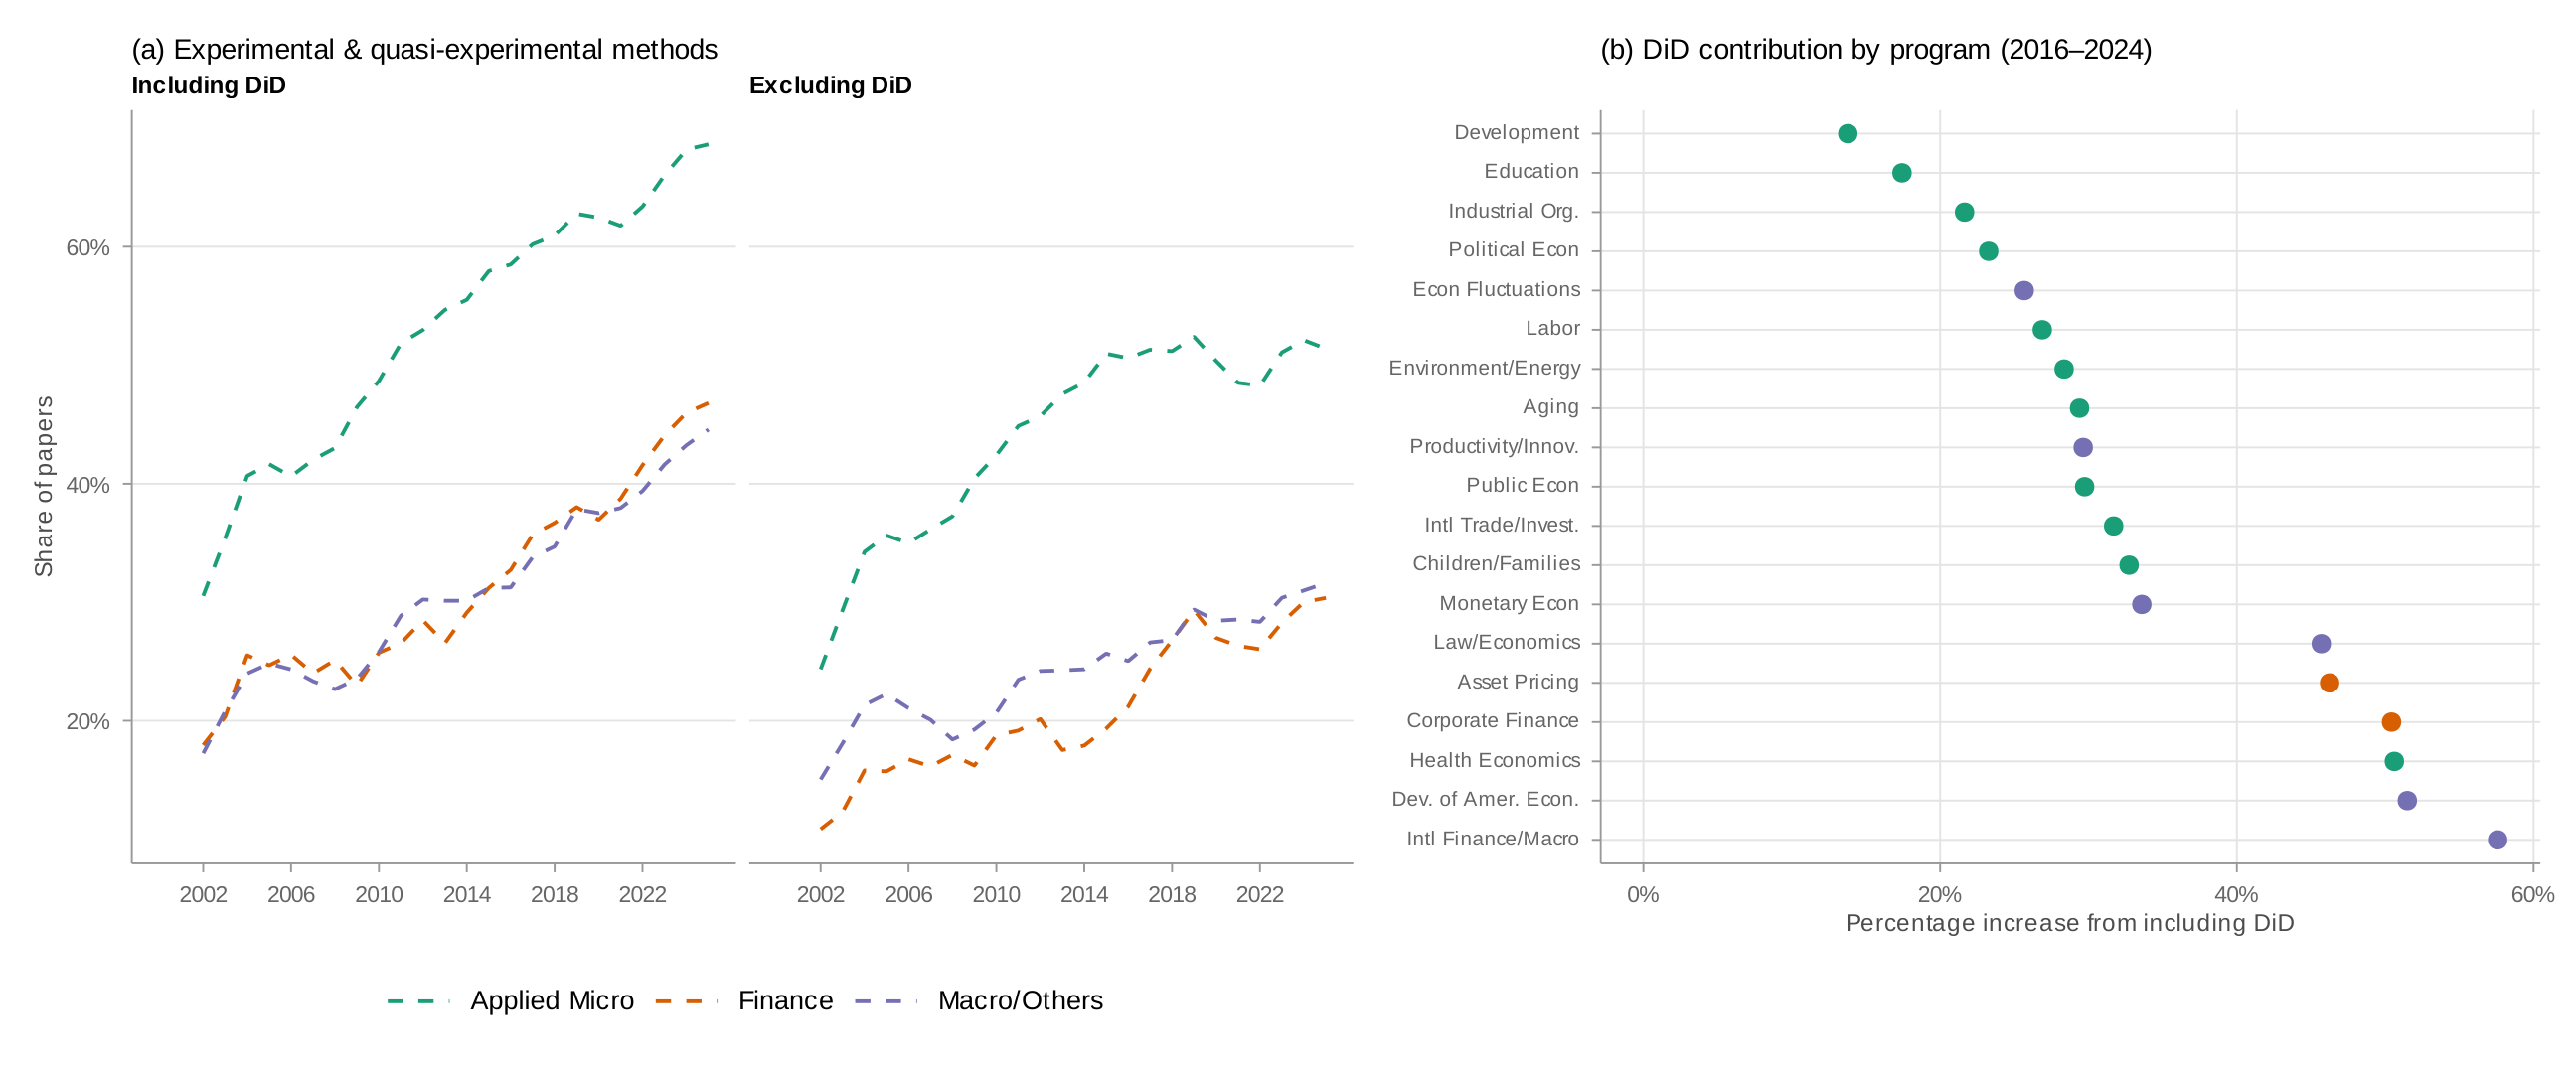
How much does this single method account for the overall growth? Figure 8 compares method shares with and without DiD.
Panel (a) breaks down the comparison by field. Over 2016–2024, including DiD raises finance's methods share by roughly 13 percentage points—a 56 percent increase—compared to a similar 13 percentage point increase for applied micro, which represents only a 29 percent increase because applied micro's baseline is much higher. Panel (b) decomposes the percentage increase by program. International Finance and Macroeconomics shows the largest increase, followed by Corporate Finance, Health Economics, and Asset Pricing. By contrast, applied micro programs with high overall method shares—such as Development Economics and Education—show relatively small increases from DiD, reflecting their diversified methodological portfolios.
3. Evidence from Top Journals
The NBER working paper series is a natural laboratory for studying methodological trends, but it has a limitation: NBER affiliates are a selected group. Do the patterns above survive in a different sample?
Overall trends across top journals
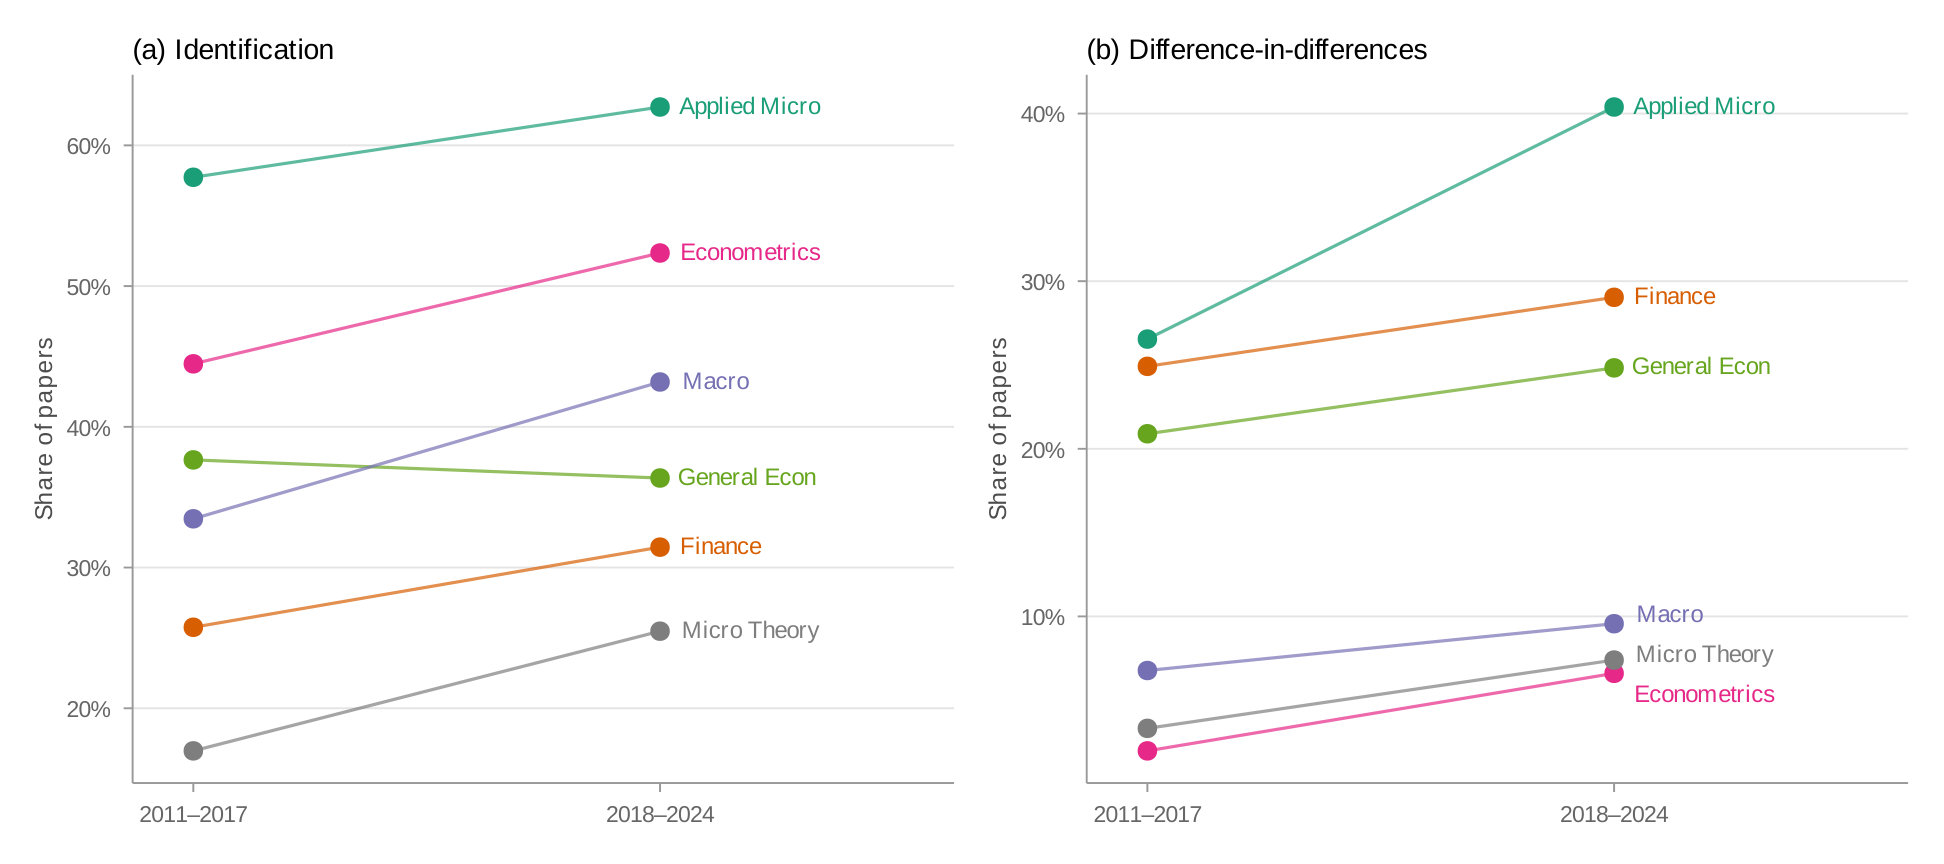
Figure 9 compares identification and DiD mentions across journal fields between 2011–2017 and 2018–2024. The field-level patterns closely mirror the NBER data. Applied micro journals show the highest rates of identification language and experimental/quasi-experimental methods, followed by finance, with macro trailing.
Comparison across individual journals
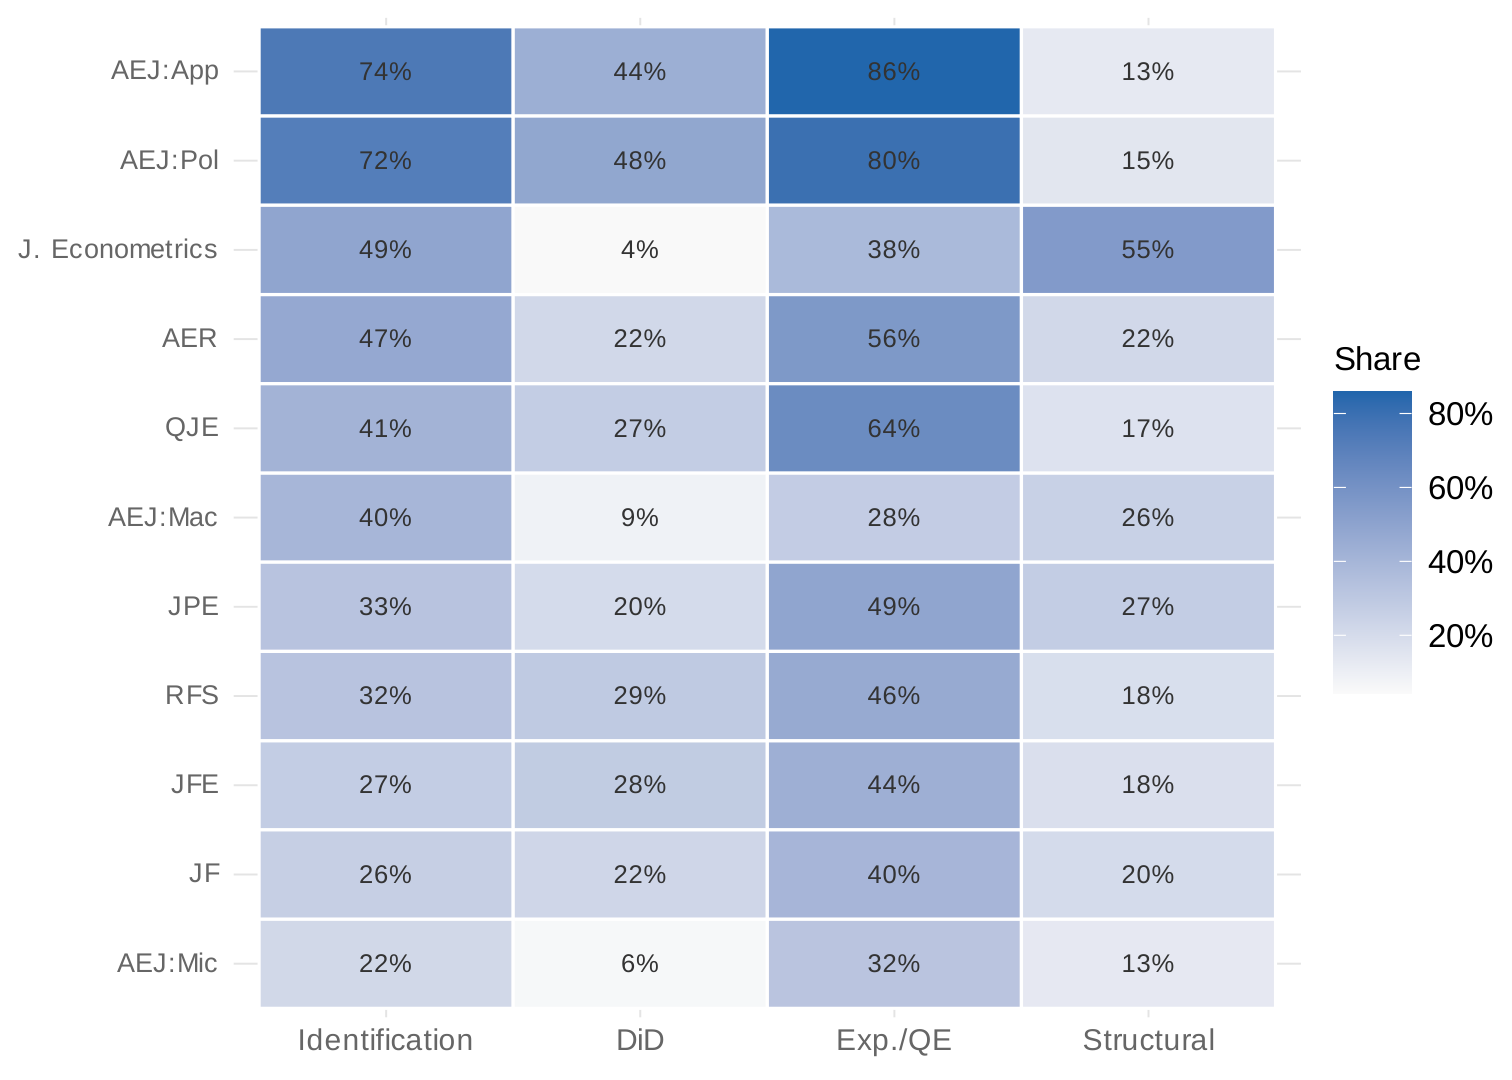
Figure 10 compares mention rates across individual journals. AEJ Applied Economics and AEJ Economic Policy show the highest rates of credibility revolution methods. Among the general-interest journals, AER and QJE show higher rates than JPE. The finance journals show moderate adoption of DiD and identification language but lower rates of RD and experimental methods.
NBER working papers vs. published articles
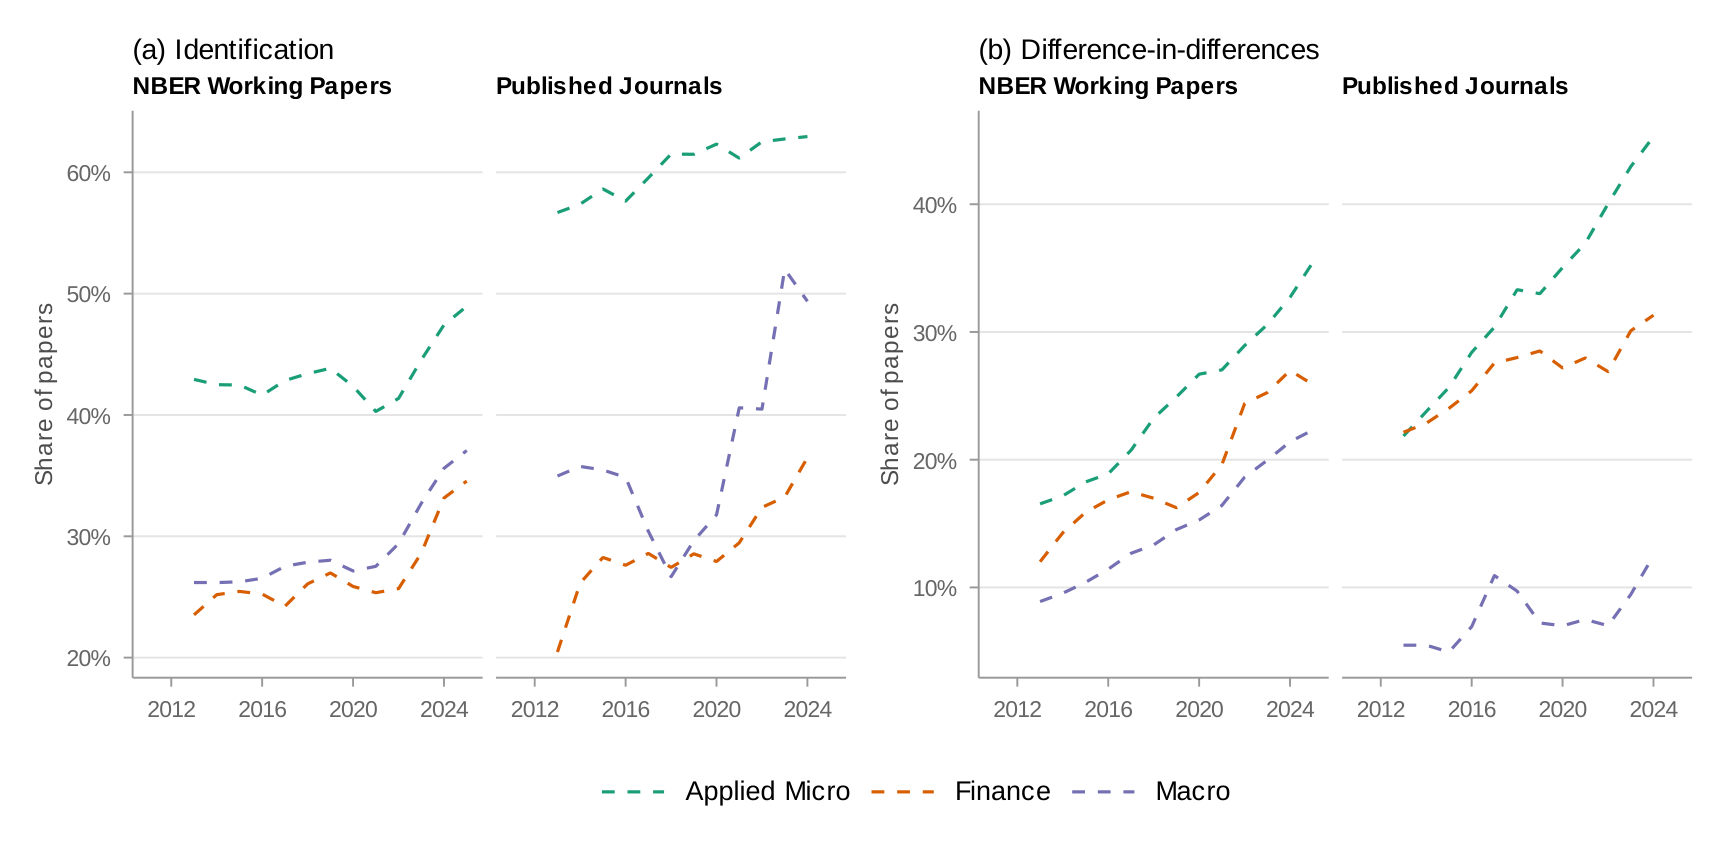
Could the NBER trends be artifacts of the working paper selection process? Figure 11 overlays the NBER and journal time series for key methods, matching by field. The trends are strikingly similar. Published articles show slightly higher rates of most credibility revolution methods—consistent with a selection effect where papers using transparent research designs are more likely to clear the bar at top journals.
4. Econometric Theory and Applied Practice
Having established that the credibility revolution has spread unevenly across applied fields, I now turn to a deeper question. The credibility revolution depends on tools developed by econometricians. If the revolution's reach has been uneven across applied fields, what about the field that supplies its theoretical infrastructure?
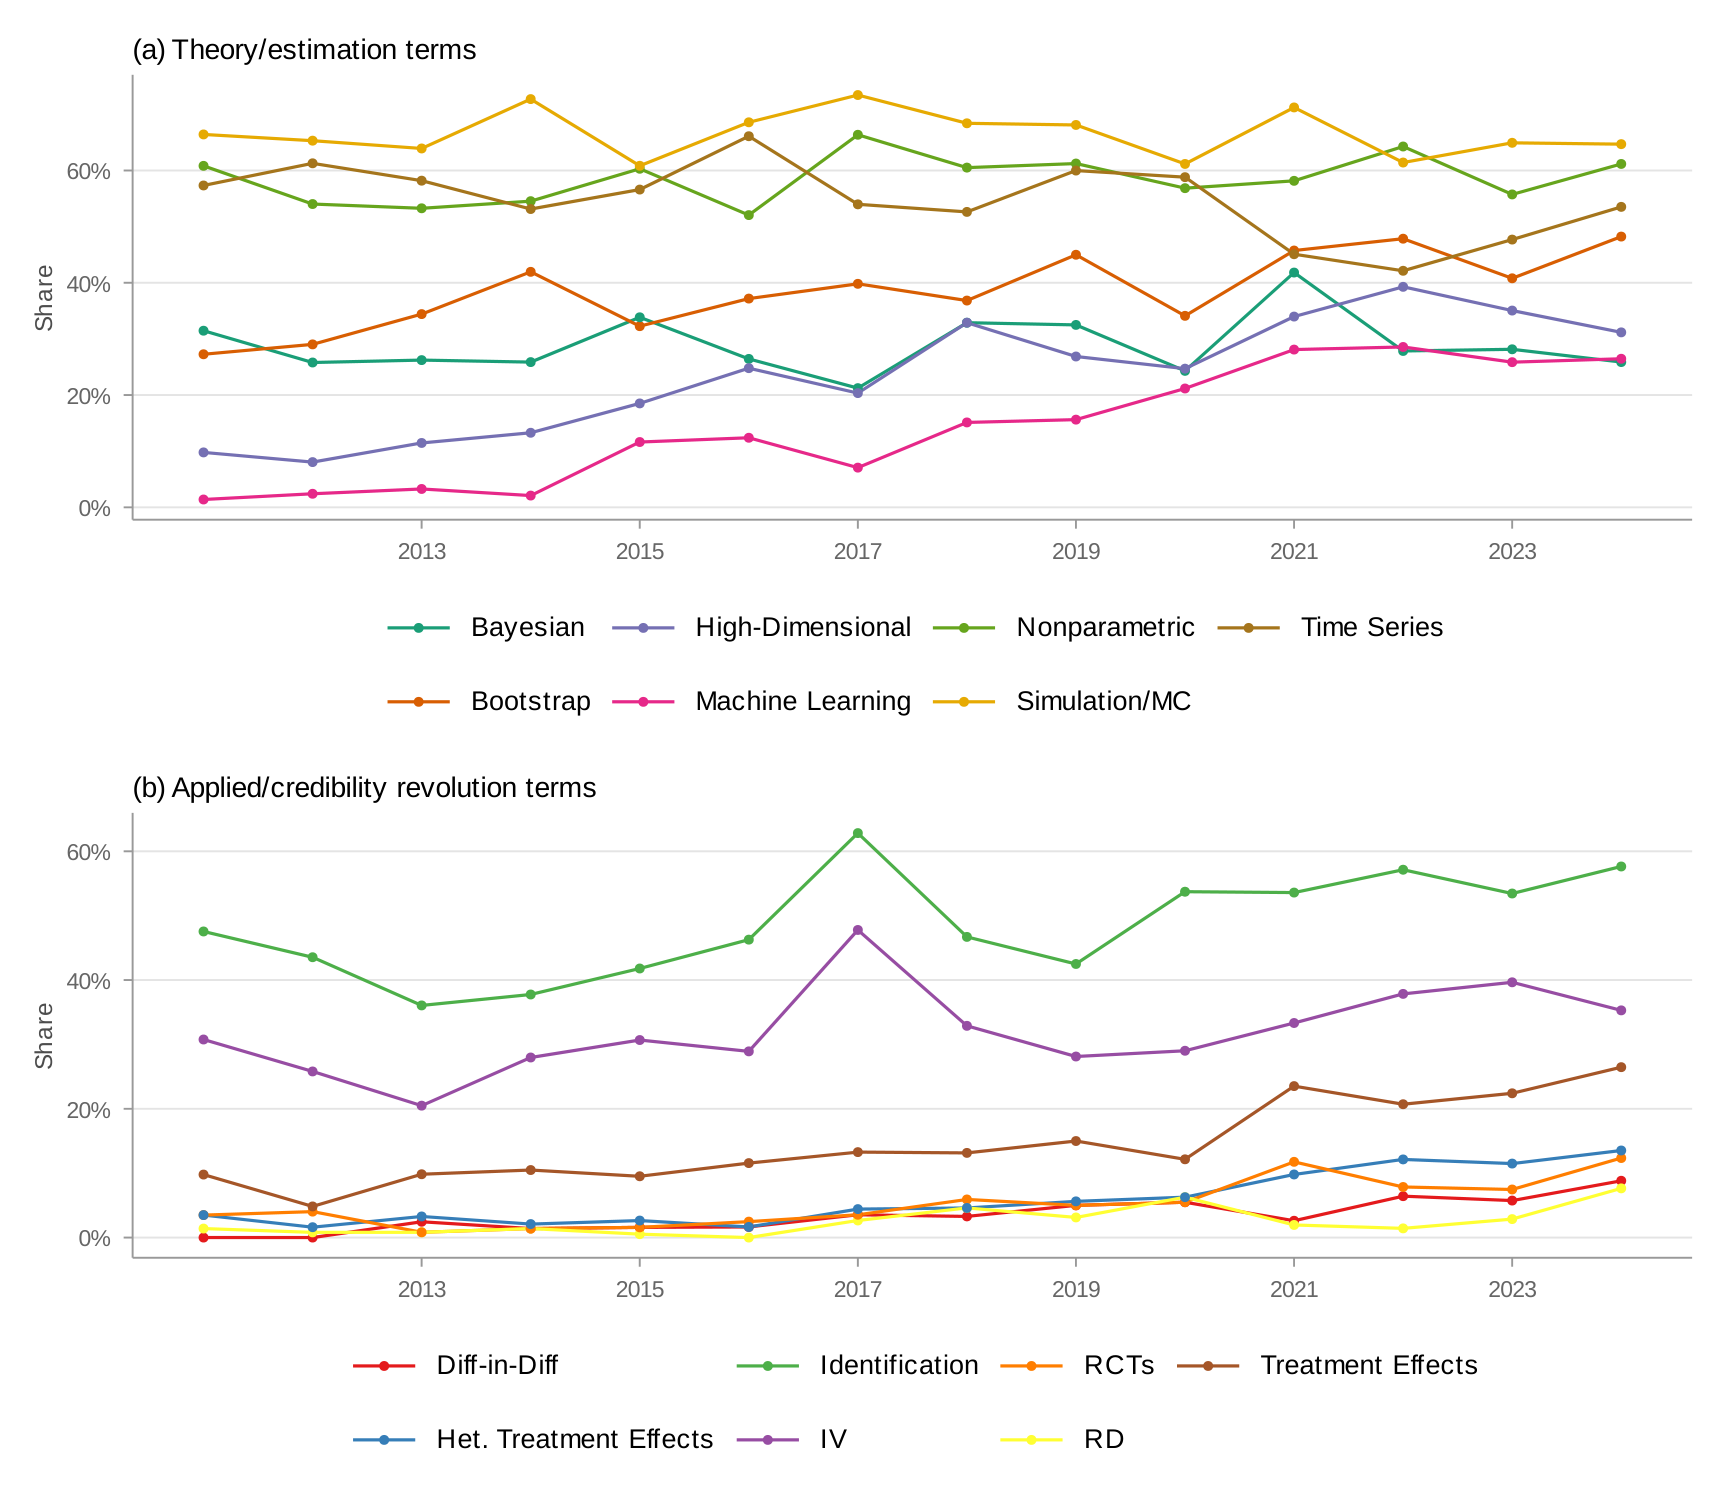
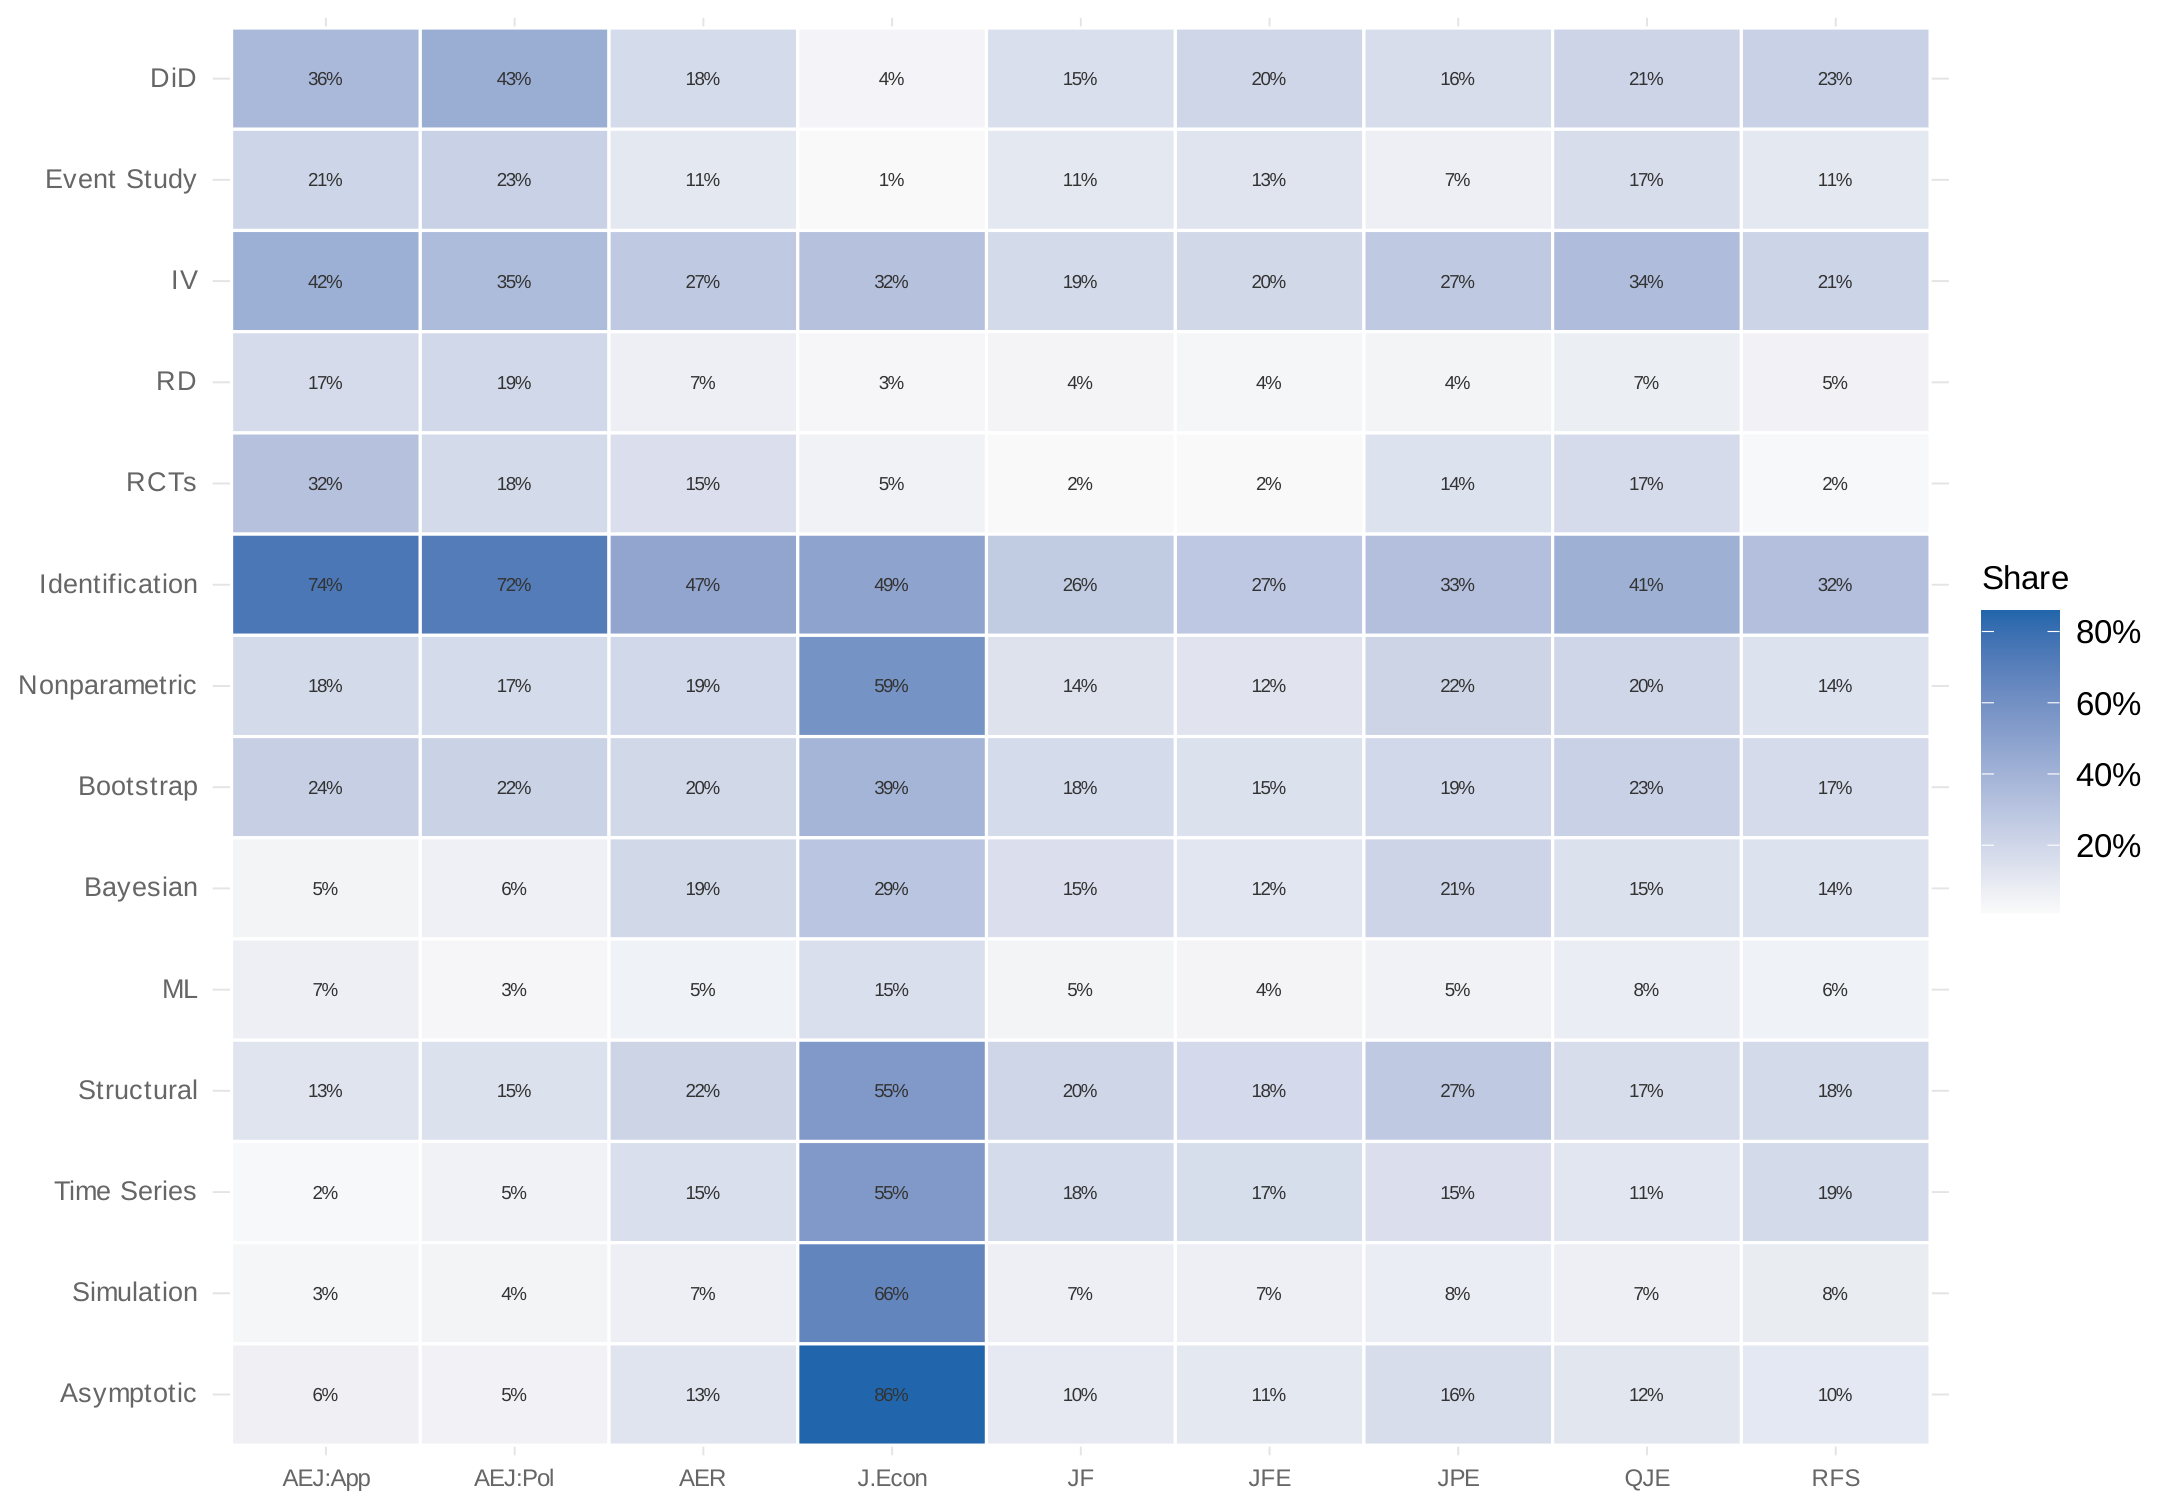
Panel (a) of Figure 12 shows which credibility revolution methods appear in the Journal of Econometrics. Most—DiD, event studies, RD, RCTs, administrative data, synthetic control—appear far less frequently than in applied journals. The exceptions are identification language and instrumental variables, reflecting the theoretical literature on these topics.
Panel (b) takes a data-driven approach: what does the Journal of Econometrics publish? I construct keyword lists for twenty candidate topic areas in econometric theory, drawn from the major sections of standard graduate econometrics textbooks and the journal's own subject classifications—nonparametric and semiparametric estimation, time series models, Bayesian methods, bootstrap and resampling, machine learning, panel data, limited dependent variables, quantile regression, kernel methods, forecasting, robust inference, weak identification, simulation, and asymptotic theory—then rank by prevalence in the Journal of Econometrics and show the top fifteen. Asymptotic theory and Monte Carlo simulation top the list—appearing in 86% and 65% of papers respectively. The more informative contrasts involve substantive methods: nonparametric estimation (58%), time series models (54%), structural/GMM/MLE methods (54%), and Bayesian methods all appear at far higher rates than in applied journals.
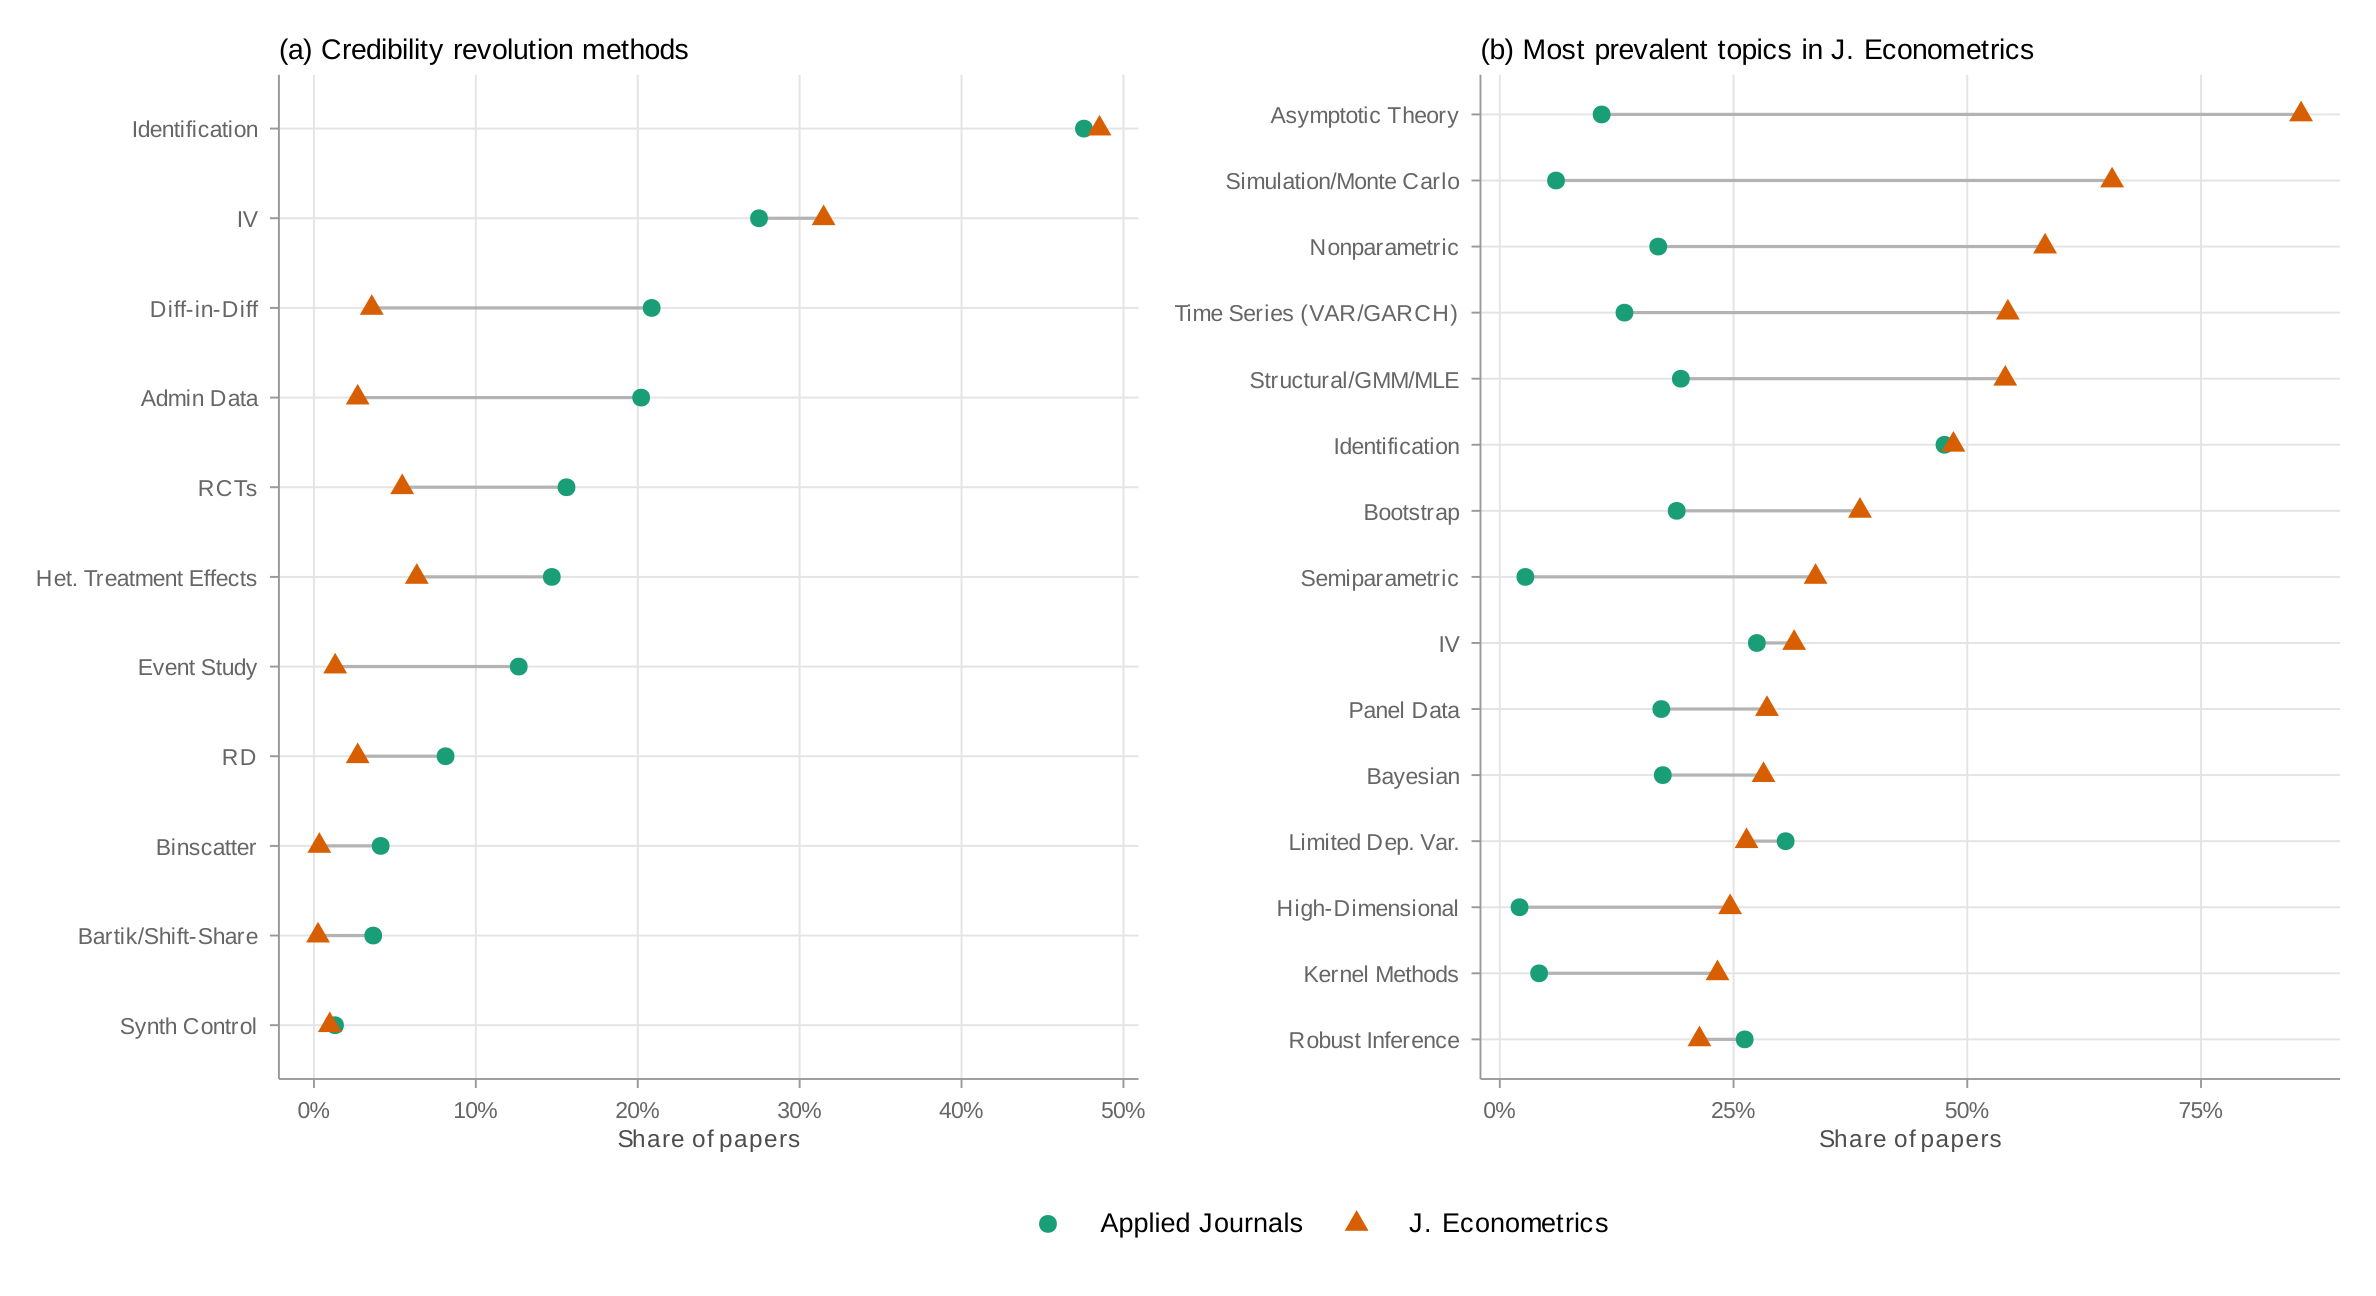
Figure 13 makes the full picture concrete. The Journal of Econometrics has a strikingly different methodological profile from every other journal in the sample.
Three caveats are important. First, the Journal of Econometrics has been at its most influential when it engages directly with the credibility revolution's tools—the literatures on heterogeneous treatment effects (De Chaisemartin and d'Haultfoeuille 2020; Callaway, Goodman-Bacon, and Sant'Anna 2024), staggered DiD (Roth 2022; Rambachan and Roth 2023), and machine learning for causal inference have reshaped applied practice. Second, the gap could reflect productive intellectual specialization rather than misalignment. Third, the cross-field differences should not be read as implying that all fields should converge to the applied micro toolkit. Nakamura and Steinsson (2018) offer a thoughtful example of how credibility revolution thinking can be adapted to macroeconomic settings.
Why does this gap matter? Because the rare instances where the two literatures do intersect have been extraordinarily productive. The DiD robustness literature—Callaway, Goodman-Bacon, and Sant'Anna (2024), De Chaisemartin and d'Haultfoeuille (2020), Sun and Abraham (2021)—moved from econometrics journals to widespread applied adoption in under five years. The gap documented here thus represents an opportunity, not just a description.
5. Conclusion
The credibility revolution has continued to advance, but the picture is one of uneven progress rather than uniform transformation. Three patterns stand out.
First, credibility revolution methods remain most prevalent in applied microeconomics. Finance and macro/other have made real strides since the early 2000s, but they differ substantially from applied micro on most measures—with current levels comparable to where applied micro was roughly a decade ago. Whether these gaps reflect a lag that will close over time or different long-run equilibria is an important open question.
Second, outside applied micro, the credibility revolution has been—to a first approximation—a difference-in-differences revolution. Over 2016–2024, including DiD raises the finance methods share by roughly 55 percent versus 30 percent for applied micro. This concentration on a single method is noteworthy given the recent econometrics literature highlighting sensitivities in DiD designs. The rapid diffusion of methodological refinements suggests that the concentration on DiD may be less concerning if practitioners are adopting improved estimators alongside the research design itself.
Third, this pattern extends to the boundary between econometric theory and applied practice. The Journal of Econometrics and applied journals occupy largely separate methodological spaces, though the gap may partly reflect productive specialization.
Looking ahead, the dominance of DiD raises a question about the trajectory of the credibility revolution. The revolution's early promise was methodological pluralism—a toolkit of transparent research designs, each suited to different empirical settings. The data show that this pluralism has been more fully realized in applied micro than elsewhere. As finance and macroeconomics continue to adopt credible methods, there is value in diversifying beyond DiD, both to strengthen the robustness of individual studies and to expand the set of questions these fields can credibly address.
References
- Adão, Rodrigo, Michal Kolesár, and Eduardo Morales. 2019. "Shift-Share Designs: Theory and Inference." The Quarterly Journal of Economics 134 (4): 1949–2010.
- Angrist, Joshua D., and Alan B. Krueger. 1991. "Does Compulsory School Attendance Affect Schooling and Earnings?" The Quarterly Journal of Economics 106 (4): 979–1014.
- Angrist, Joshua D., and Jörn-Steffen Pischke. 2009. Mostly Harmless Econometrics: An Empiricist's Companion. Princeton University Press.
- Angrist, Joshua D., and Jörn-Steffen Pischke. 2010. "The Credibility Revolution in Empirical Economics: How Better Research Design Is Taking the Con out of Econometrics." Journal of Economic Perspectives 24 (2): 3–30.
- Anthropic. 2025. "Claude Language Models." anthropic.com.
- Arkhangelsky, Dmitry, Susan Athey, David A. Hirshberg, Guido W. Imbens, and Stefan Wager. 2021. "Synthetic Difference-in-Differences." American Economic Review 111 (12): 4088–4118.
- Autor, David H., David Dorn, and Gordon H. Hanson. 2013. "The China Syndrome: Local Labor Market Effects of Import Competition in the United States." American Economic Review 103 (6): 2121–2168.
- Bartik, Timothy J. 1991. Who Benefits from State and Local Economic Development Policies? W.E. Upjohn Institute for Employment Research.
- Borusyak, Kirill, Peter Hull, and Xavier Jaravel. 2022. "Quasi-Experimental Shift-Share Research Designs." The Review of Economic Studies 89 (1): 181–213.
- Boustan, Leah Platt. 2010. "Was Postwar Suburbanization 'White Flight'? Evidence from the Black Migration." The Quarterly Journal of Economics 125 (1): 417–443.
- Brodeur, Abel, Nikolai Cook, and Anthony Heyes. 2024. "Mass Reproducibility and Replicability: A New Hope." American Economic Review 114 (11): 3564–3610.
- Brodeur, Abel, Nikolai Cook, and Anthony Heyes. 2020. "Methods Matter: p-Hacking and Publication Bias in Causal Analysis in Economics." American Economic Review 110 (11): 3634–3660.
- Callaway, Brantly, Andrew Goodman-Bacon, and Pedro H.C. Sant'Anna. 2024. "Difference-in-Differences with a Continuous Treatment." NBER Working Paper.
- Currie, Janet, Henrik Kleven, and Esmée Zwiers. 2020. "Technology and Big Data Are Changing Economics: Mining Text to Track Methods." AEA Papers and Proceedings 110: 42–48.
- Currie, Janet, Henrik Kleven, and Esmée Zwiers. 2020b. "Data and Code for Technology and Big Data Are Changing Economics." doi.org/10.3886/E120827V1.
- De Chaisemartin, Clément, and Xavier d'Haultfoeuille. 2020. "Two-Way Fixed Effects Estimators with Heterogeneous Treatment Effects." American Economic Review 110 (9): 2964–2996.
- de Chaisemartin, Clément, Xavier d'Haultfoeuille, Félix Pasquier, and Gonzalo Vazquez-Bare. 2022. "Difference-in-Differences Estimators for Treatments Continuously Distributed at Every Period." arXiv:2201.06898.
- Garg, Nikhil, and Thiemo Fetzer. 2025. "Tracking the Credibility Revolution Across Fields Using LLMs." Working Paper.
- Goldsmith-Pinkham, Paul, Isaac Sorkin, and Henry Swift. 2020. "Bartik Instruments: What, When, Why, and How." American Economic Review 110 (8): 2586–2624.
- Imbens, Guido W., and Thomas Lemieux. 2008. "Regression Discontinuity Designs: A Guide to Practice." Journal of Econometrics 142 (2): 615–635.
- Nakamura, Emi, and Jón Steinsson. 2018. "Identification in Macroeconomics." Journal of Economic Perspectives 32 (3): 59–86.
- Rambachan, Ashesh, and Jonathan Roth. 2023. "A More Credible Approach to Parallel Trends." Review of Economic Studies 90 (5): 2555–2591.
- Roth, Jonathan. 2022. "Pretest with Caution: Event-Study Estimates after Testing for Parallel Trends." American Economic Review: Insights 4 (3): 305–322.
- Roth, Jonathan, and Pedro H.C. Sant'Anna. 2023. "When Is Parallel Trends Sensitive to Functional Form?" Econometrica 91 (2): 737–747.
- Sun, Liyang, and Sarah Abraham. 2021. "Estimating Dynamic Treatment Effects in Event Studies with Heterogeneous Treatment Effects." Journal of Econometrics 225 (2): 175–199.
Appendix
Appendix A: Search Categories and Trigger Phrases
Unless noted otherwise, the outcome is the fraction of papers with at least one phrase match. "Figure" and "Table" categories use average word count per paper.
| Category | Trigger Phrases | Case Sens. | Wildcard | Cond. data |
|---|---|---|---|---|
| Administrative Data | 'administrative data', 'admin data', 'administrative-data', 'admin-data', 'administrative record', 'admin record', 'administrative regist', 'admin regist', 'register data', 'registry data' | No | Yes | Yes |
| Big Data | 'big data', 'big-data' | No | Yes | Yes |
| Binscatter | 'binscatter', 'bin scatter', 'binned scatter' | No | Yes | No |
| Bunching | 'bunching' | No | Yes | No |
| Clustering | 'cluster' | No | Yes | Yes |
| Confidence Interval | 'confidence interval' | No | Yes | Yes |
| Data | 'data' | No | Yes | No |
| Difference-in-Differences | 'Difference in Diff', 'difference in diff', 'Difference-in-Diff', 'difference-in-diff', 'Differences in Diff', 'differences in diff', 'Differences-in-Diff', 'differences-in-diff', 'diff-in-diff', 'd-in-d', 'DiD' | Yes | Yes | No |
| Event Study | 'event stud', 'event-stud' | No | Yes | No |
| External Validity | 'external validity', 'external-validity', 'externally valid', 'externally-valid' | No | Yes | No |
| Fixed Effects | 'FE', 'Fixed Effect', 'fixed effect', 'Fixed Effects', 'fixed effects', 'Fixed-Effect', 'fixed-effect', 'Fixed-Effects', 'fixed-effects' | Yes | No | Yes |
| General Equilibrium | 'general equilibr', 'general-equilibr' | No | Yes | No |
| Identification | Sentence structure: 'identif' in combination with 'effect', 'response', 'impact', 'elasticit', 'parameter', or 'coefficient' (max two words between). Also: 'causal identification', 'identification strategy', 'identification assumption', 'identifying assumption', 'identifying variation', 'partial identification', 'point identification', 'set identification', 'weak identification', etc. | No | Yes | No |
| Instrumental Variables | 'Instrumental Variable', 'instrumental variable', 'Two Stage Least Squares', 'two stage least squares', '2SLS', 'TSLS', 'valid instrument', 'exogenous instrument', 'IV Estimat', 'IV estimat', 'exclusion restriction', 'weak first stage', 'simulated instrument', etc. | Yes | Yes | Yes |
| Lab Experiments | 'Laboratory Experiment', 'lab experiment', 'Dictator Game', 'dictator game', 'Ultimatum Game', 'Trust Game', 'trust game', 'Public Good Game', 'Z-tree', 'zTree', 'ORSEE', 'show-up fee', etc. | Yes | Yes | No |
| Machine Learning | 'machine learning', 'lasso', 'random forest' | No | Yes | No |
| Matching | 'propensity score', 'propensity score matching', 'matching estimat', 'nearest neighbor matching', 'caliper matching', 'exact matching', 'kernel matching', 'inverse probability matching', etc. | No | Yes | Yes |
| Quasi- and Natural Experiments | 'quasi experiment', 'quasi-experiment', 'quasiexperiment', 'natural experiment', 'natural-experiment' | No | Yes | No |
| RCTs | 'Randomized Controlled Trial', 'randomized controlled trial', 'RCT', 'randomized experiment', 'randomised experiment', 'randomized evaluation', 'field experiment', 'Social Experiment', etc. | Yes | Yes | No |
| Regression Discontinuity | 'Regression Discontinuit', 'regression discontinuit', 'Regression Kink', 'regression kink', 'RD Design', 'RD design', 'RD Estimat', 'RDD', 'RKD', etc. | Yes | Yes | No |
| Structural Model | Sentence structure: 'structural' + 'model'/'specification'/'estimate'/'parameter' within two sentences. Also: 'Structural Model', 'Method of Moments', 'BLP', 'GMM', 'Maximum Likelihood Estimat', 'MLE', etc. | Yes | Yes | No |
| Survey Data | Sentence structure: 'survey' and 'data' within two sentences. | No | Yes | Yes |
| Synthetic Control | 'synthetic control' | No | Yes | Yes |
| Text Analysis | 'natural language processing', 'text analys', 'computational linguistics', 'text data', 'text mining', 'tokeniz', etc. | No | Yes | No |
| Econometrics categories (Section 4) | ||||
| Asymptotic Theory | 'asymptot', 'large sample', 'convergence rate', 'consistency', 'limiting distribut' | No | Yes | No |
| Bayesian | 'Bayesian', 'posterior distribut', 'prior distribut', 'Markov chain Monte Carlo', 'MCMC' | Mixed | Yes | No |
| Bootstrap | 'bootstrap', 'resampl' | No | Yes | No |
| Nonparametric | 'nonparametric', 'non-parametric', 'non parametric' | No | Yes | No |
| Time Series (VAR/GARCH) | 'VAR', 'vector autoregress', 'ARMA', 'ARIMA', 'unit root', 'cointegrat', 'GARCH', 'ARCH', 'stationarity', 'impulse response' | Mixed | Yes | No |
| Simulation/Monte Carlo | 'Monte Carlo', 'MCMC', 'Markov chain Monte', 'Gibbs sampl' | Mixed | Yes | No |
| Treatment Effects | 'treatment effect', 'average treatment', 'causal effect' | No | Yes | No |
Appendix B: LLM Validation of Keyword Matching
I classify a stratified sample of approximately 750 papers using Claude Haiku 4.5. For each paper, I provide the first 1,500 words and ask the model to identify which methods are actually used, as opposed to merely mentioned. I then compare the LLM classification with the keyword flags.
| Method | N | Accuracy | Precision | Recall | F1 | κ |
|---|---|---|---|---|---|---|
| DiD | 750 | 86.7% | 47.1% | 80.2% | 59.3% | 0.520 |
| Event Study | 750 | 86.5% | 43.2% | 64.3% | 51.7% | 0.442 |
| IV | 750 | 80.4% | 37.6% | 93.4% | 53.6% | 0.439 |
| RD | 750 | 91.6% | 43.5% | 95.9% | 59.9% | 0.559 |
| RCT | 750 | 86.8% | 40.3% | 94.1% | 56.4% | 0.500 |
| Lab Experiment | 750 | 92.7% | 37.5% | 85.7% | 52.2% | 0.489 |
| Identification Strategy | 750 | 65.6% | 39.4% | 75.0% | 51.7% | 0.288 |
| Structural Model | 750 | 69.1% | 59.1% | 36.0% | 44.8% | 0.250 |
| Administrative Data | 750 | 65.9% | 79.4% | 39.5% | 52.8% | 0.305 |
Notes: Keyword-based classification treated as positive when any pattern matches. LLM classification uses Qwen3.5-122B-A10B-FP8 with temperature 0. Precision and recall measured with keyword as the classifier and LLM as ground truth.
| Method | Overall | Applied Micro | Finance | Macro/Others |
|---|---|---|---|---|
| DiD | 85.7% | 83.2% | 90.1% | 93.6% |
| Event Study | 84.7% | 83.2% | 79.1% | 90.4% |
| IV | 80.8% | 80.2% | 84.6% | 89.4% |
| RD | 91.5% | 88.6% | 97.8% | 96.8% |
| RCT | 90.7% | 88.2% | 96.7% | 100.0% |
| Lab Experiment | 91.3% | 88.6% | 96.7% | 98.9% |
| Identification Strategy | 66.1% | 61.7% | 69.2% | 81.9% |
| Structural Model | 65.7% | 69.7% | 65.9% | 57.4% |
| Administrative Data | 67.7% | 64.7% | 68.1% | 71.3% |
Notes: Agreement rates between keyword-based and LLM-based classification, stratified by field.
Benchmark against hand-coded classifications
| Method | Nhand | Nkw | Precision | Recall | F1 | Accuracy | κ |
|---|---|---|---|---|---|---|---|
| DID | 164 | 198 | 69.2% | 83.5% | 75.7% | 82.4% | 0.621 |
| IV | 164 | 270 | 57.8% | 95.1% | 71.9% | 75.6% | 0.526 |
| RCT | 108 | 134 | 67.2% | 83.3% | 74.4% | 87.6% | 0.663 |
| RDD | 65 | 94 | 64.9% | 93.8% | 76.7% | 92.6% | 0.725 |
Notes: Benchmark against hand-coded classifications from Brodeur, Cook, and Heyes (2024). 501 papers matched by title.
| Method | Keywords | Qwen 3.5-122B | ||||
|---|---|---|---|---|---|---|
| Precision | Recall | F1 | Precision | Recall | F1 | |
| DID | 68.0% | 99.2% | 80.7% | 84.4% | 78.6% | 81.4% |
| IV | 69.1% | 100.0% | 81.7% | 90.3% | 57.9% | 70.6% |
| RDD | 74.3% | 94.5% | 83.2% | 88.9% | 87.3% | 88.1% |
| RCT | 81.2% | 83.9% | 82.5% | 91.6% | 93.5% | 92.6% |
Notes: Both approaches benchmarked against hand-coded method labels from Brodeur, Cook, and Heyes (2020). Sample of 357 papers matched by journal, year, and title across nine journals (2011–2020).
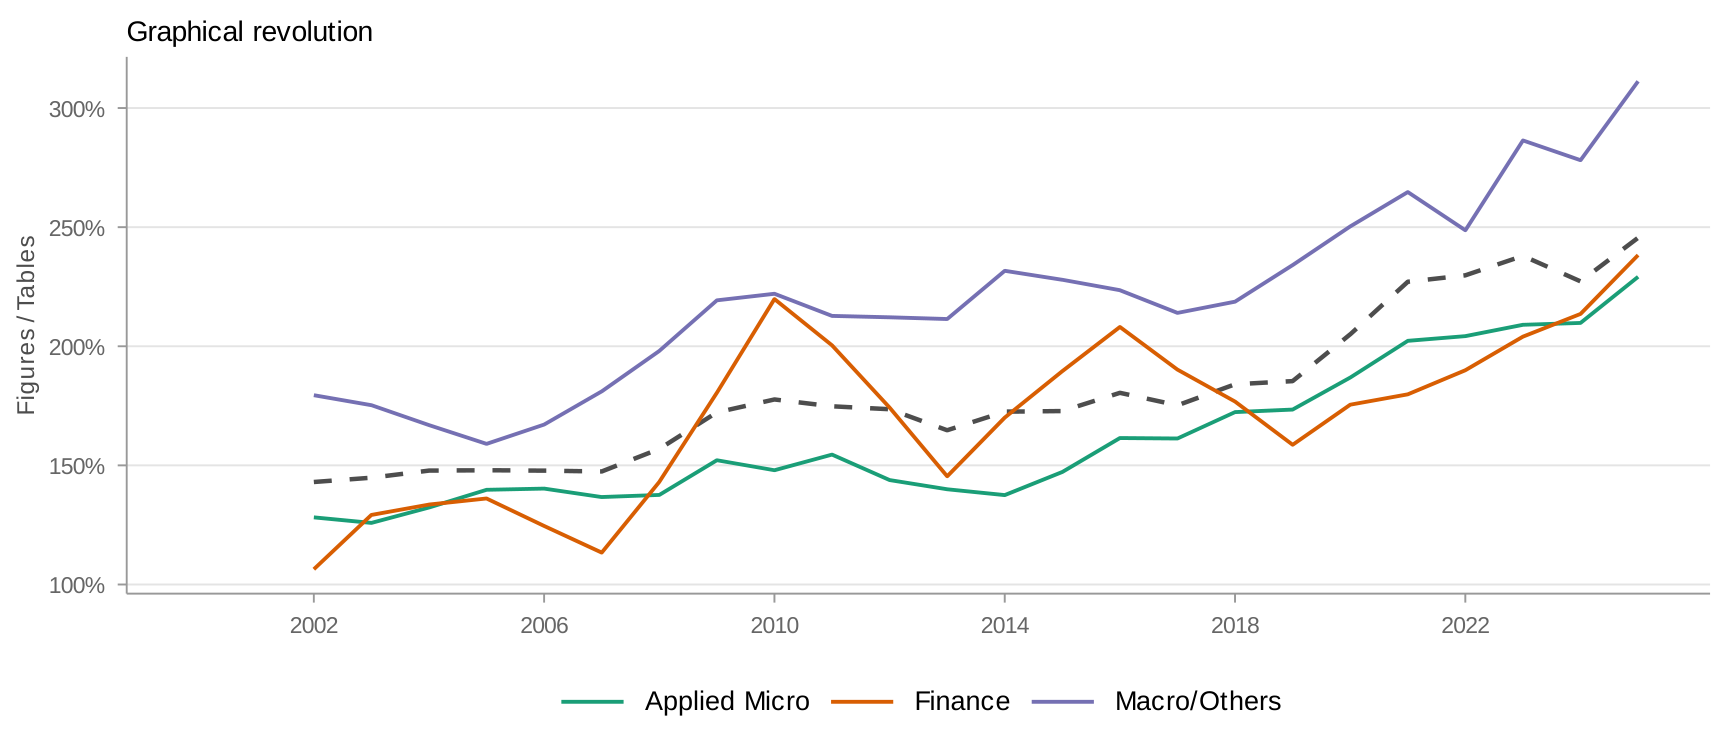
Appendix C: Graphical Revolution
Appendix D: DiD Decomposition — Strict DiD vs. Event Studies
The main text uses a composite "DiD" measure. This appendix decomposes strict DiD language from event study mentions.
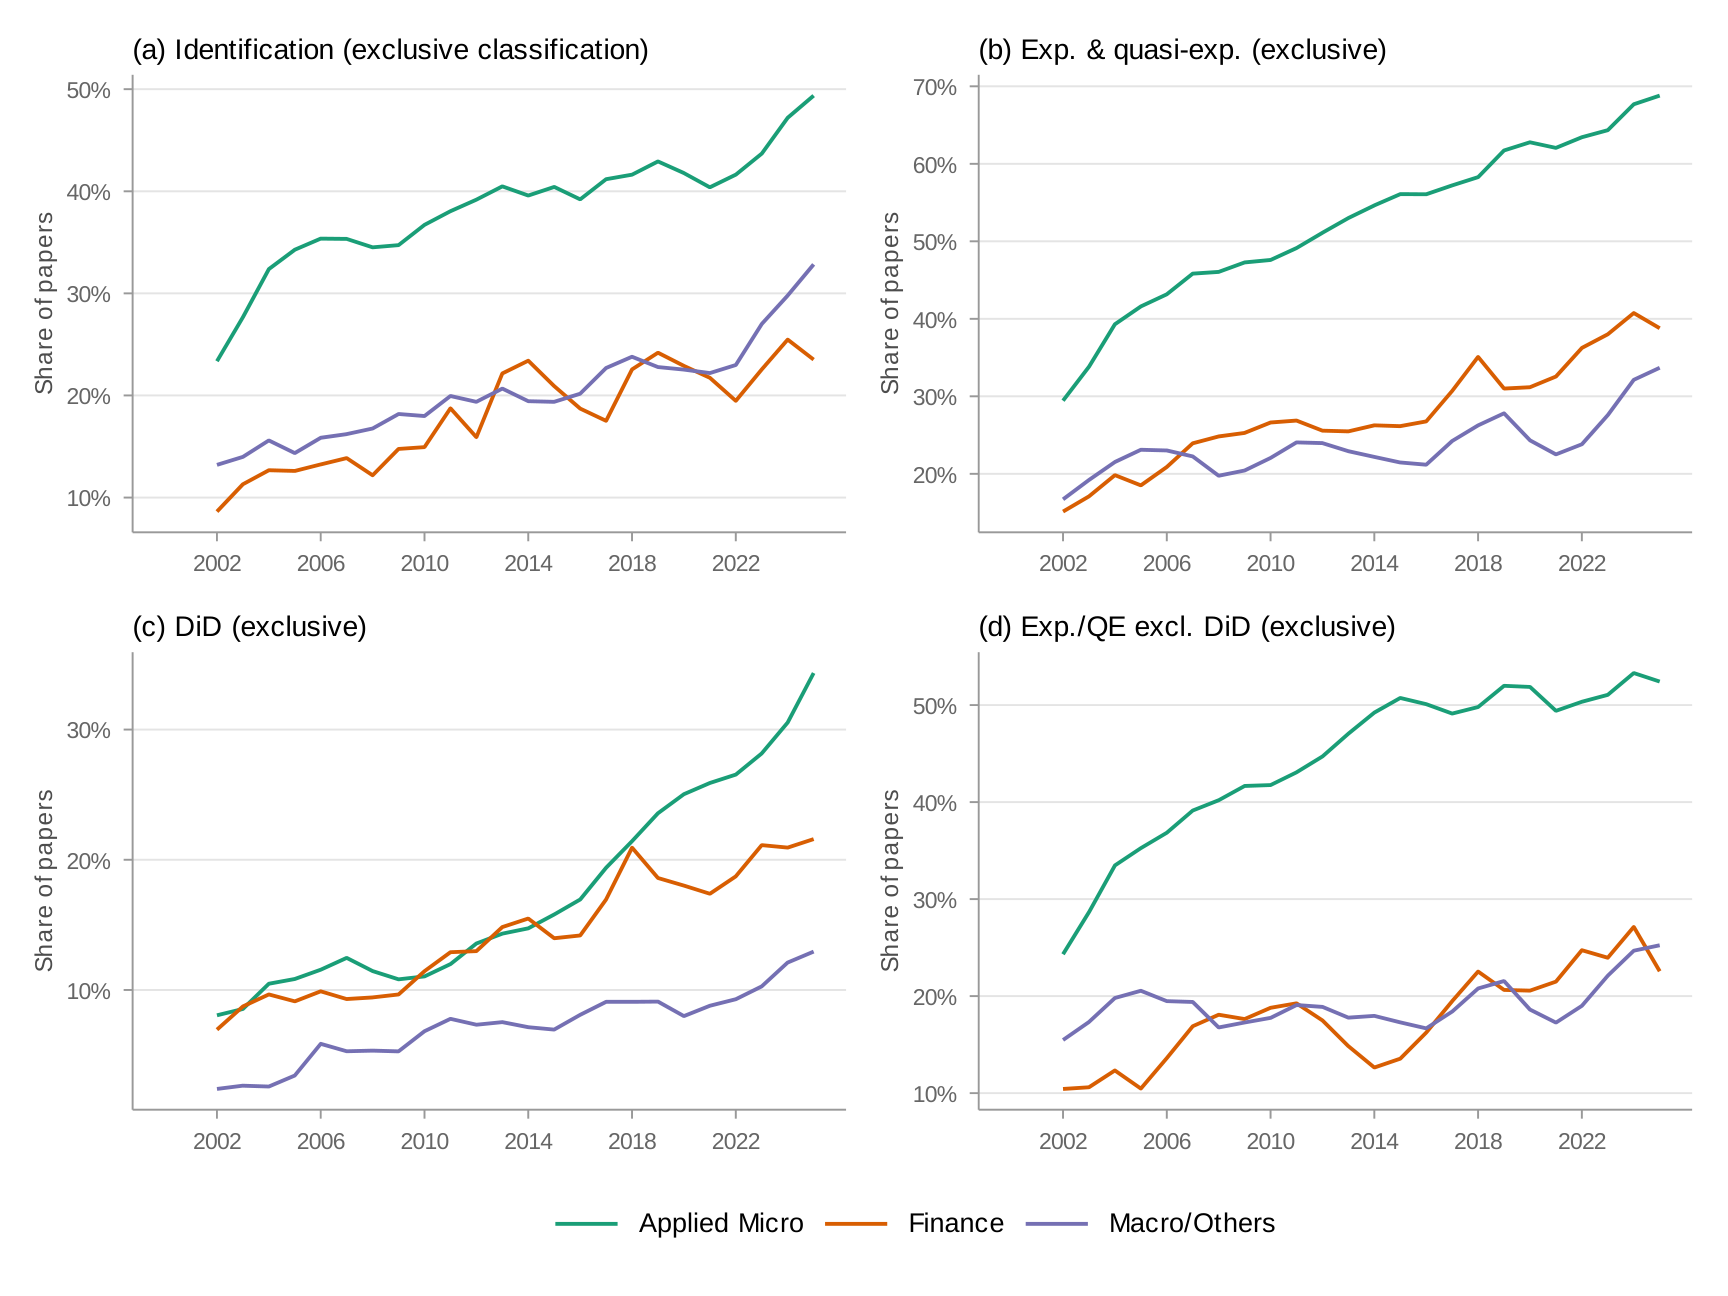
Appendix E: Exclusive Field Classification
Papers assigned to a single field based on their program affiliations. Cross-listed papers are excluded. Sample: 18,697 papers (11,828 Applied Micro, 1,758 Finance, 5,111 Macro/Others).
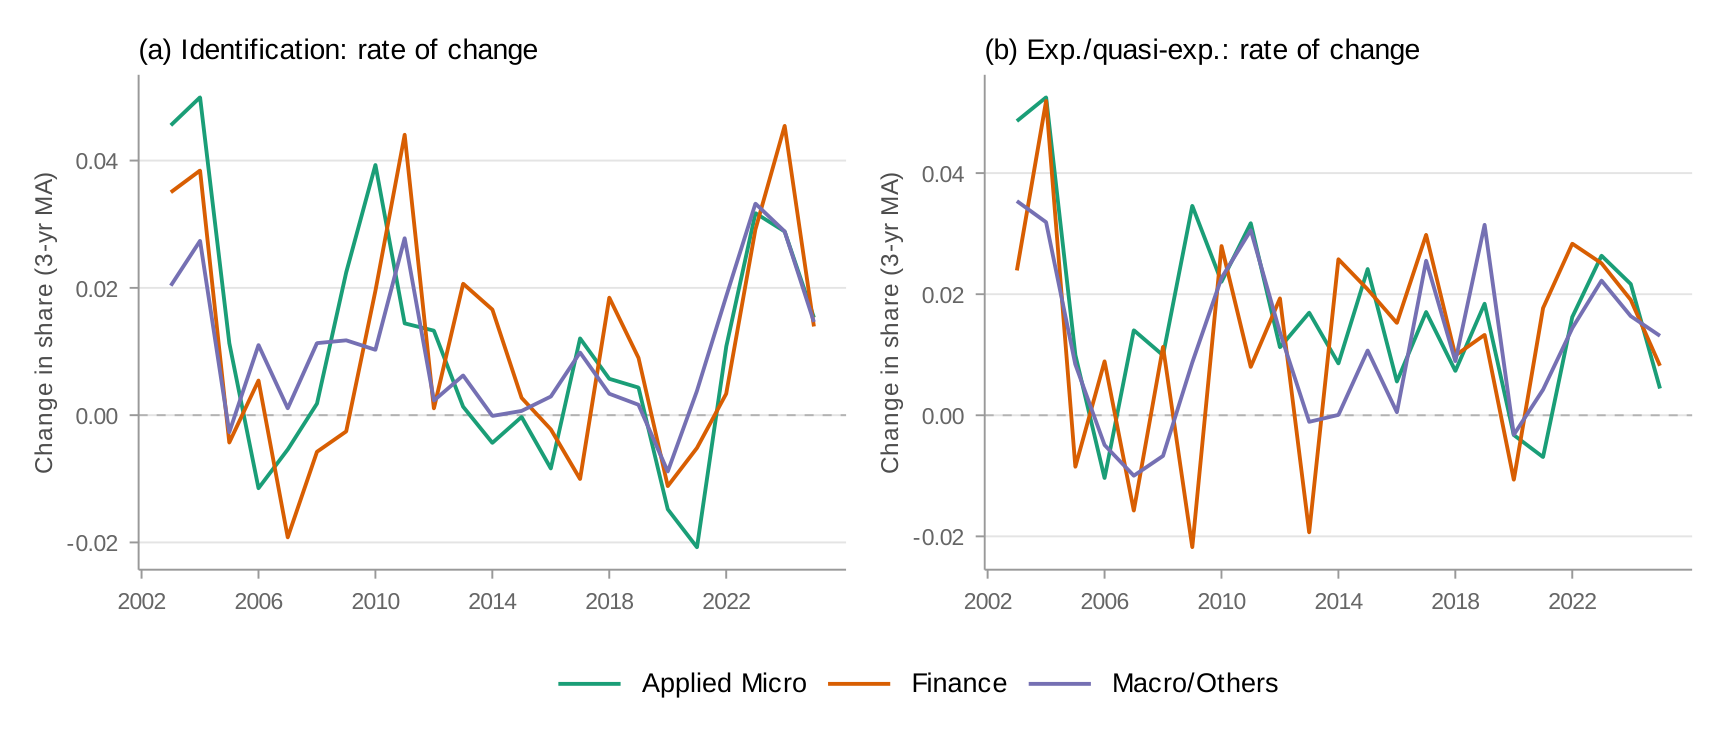
Appendix F: Rate of Change across Fields
Appendix G: Structural Model Measure — Broad vs. Narrow
Appendix H: Denominator Composition
Restricting to "empirical" papers—those mentioning at least one empirical method or data source—narrows the gap from 63/47/39 percent (unconditional) to 76/65/61 percent (conditional) for experimental and quasi-experimental methods in 2024. The gap clearly persists.
Appendix I: Synthetic Control and Synthetic DiD
Appendix J: Top Journals — IV and Structural Model Trends
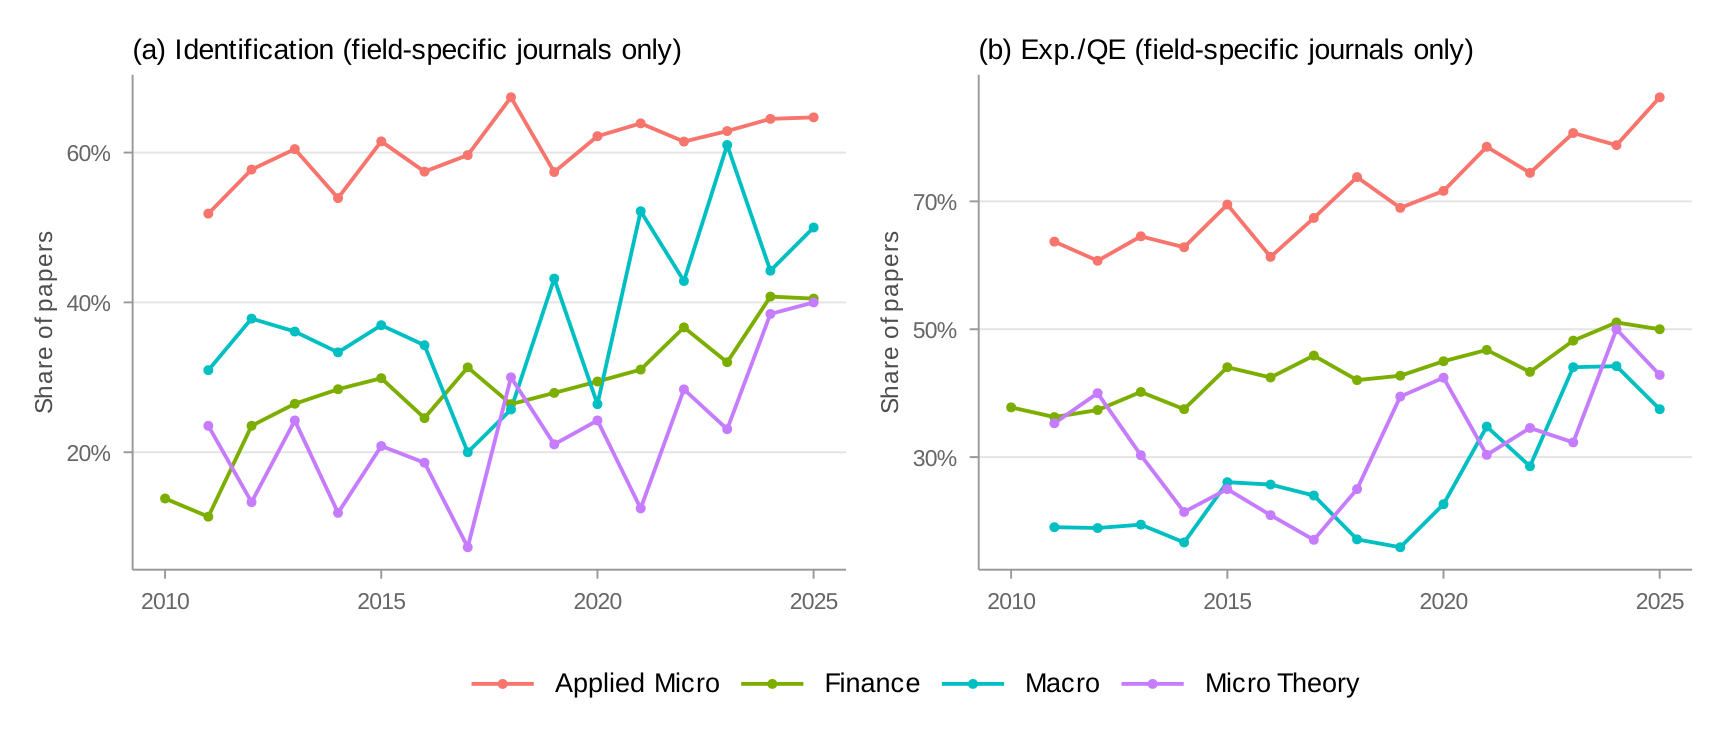
Appendix K: Journal Analysis — Excluding General Economics Journals
Appendix L: Journal Text Extraction Coverage
| Journal | 2011 | 2012 | 2013 | 2014 | 2015 | 2016 | 2017 | 2018 | 2019 | 2020 | 2021 | 2022 | 2023 | 2024 | 2025 | Total |
|---|---|---|---|---|---|---|---|---|---|---|---|---|---|---|---|---|
| AEJ Applied | 30/37 | 40/40 | 47/47 | 30/30 | 45/45 | 37/37 | 31/31 | 46/46 | 44/45 | 50/50 | 41/41 | 63/63 | 55/55 | 64/64 | 28/28 | 651/659 (99%) |
| AEJ Macro | 31/32 | 30/31 | 36/36 | 24/24 | 43/43 | 30/30 | 24/24 | 32/32 | 40/40 | 48/48 | 46/46 | 56/56 | 52/52 | 50/50 | 30/30 | 572/574 (100%) |
| AEJ Micro | 38/38 | 31/31 | 34/34 | 44/44 | 49/49 | 43/43 | 41/41 | 40/40 | 38/38 | 34/34 | 56/56 | 82/82 | 65/65 | 52/52 | 35/35 | 682/682 (100%) |
| AEJ Policy | 29/30 | 37/37 | 44/44 | 45/45 | 46/46 | 39/39 | 51/52 | 48/48 | 54/54 | 51/51 | 57/57 | 63/64 | 64/64 | 64/64 | 48/48 | 740/743 (100%) |
| AER | 260/274 | 260/264 | 257/259 | 255/257 | 261/262 | 273/274 | 244/264 | 112/113 | 134/134 | 120/120 | 115/115 | 114/115 | 95/96 | 111/111 | 87/87 | 2698/2745 (98%) |
| J. Econometrics | 150/150 | 136/136 | 135/135 | 150/150 | 195/195 | 129/129 | 118/118 | 159/159 | 165/165 | 262/262 | 164/164 | 143/143 | 192/192 | 175/175 | 161/161 | 2434/2434 (100%) |
| J. Finance | 61/63 | 93/94 | 102/105 | 78/82 | 100/103 | 85/130 | 71/84 | 87/104 | 85/103 | 88/98 | 81/90 | 77/86 | 94/100 | 95/98 | 74/89 | 1271/1429 (89%) |
| JFE | 139/140 | 123/125 | 135/136 | 114/116 | 86/87 | 134/137 | 112/114 | 162/164 | 136/142 | 141/143 | 269/273 | 88/89 | 80/82 | 114/120 | 122/147 | 1955/2015 (97%) |
| JPE | 24/36 | 33/43 | 31/44 | 29/46 | 41/55 | 33/55 | 72/97 | 89/121 | 66/89 | 75/97 | 69/93 | 86/115 | 80/115 | 79/108 | 73/93 | 880/1207 (73%) |
| QJE | 46/47 | 56/56 | 36/45 | 38/46 | 39/47 | 45/54 | 51/52 | 32/32 | 39/40 | 50/51 | 48/48 | 42/42 | 54/54 | 38/45 | 38/48 | 652/707 (92%) |
| RFS | 0/114 | 96/101 | 95/100 | 97/98 | 109/121 | 97/104 | 143/147 | 132/138 | 143/145 | 144/147 | 135/137 | 94/94 | 93/95 | 85/89 | 86/111 | 1549/1741 (89%) |
| Excluded from main analysis (robustness only): | ||||||||||||||||
| Econometrica | 1/70 | 0/99 | 0/89 | 0/83 | 42/86 | 54/77 | 61/82 | 61/84 | 58/83 | 87/111 | 91/113 | 91/115 | 75/100 | 64/89 | 58/79 | 743/1360 (55%) |
| R. Econ. Stud. | 0/84 | 0/47 | 0/51 | 0/44 | 0/53 | 0/65 | 0/72 | 0/75 | 0/63 | 0/94 | 0/98 | 0/77 | 0/115 | 0/113 | — | 0/1051 (0%) |
Appendix M: J. Econometrics — Time Trends in Credibility Revolution Methods