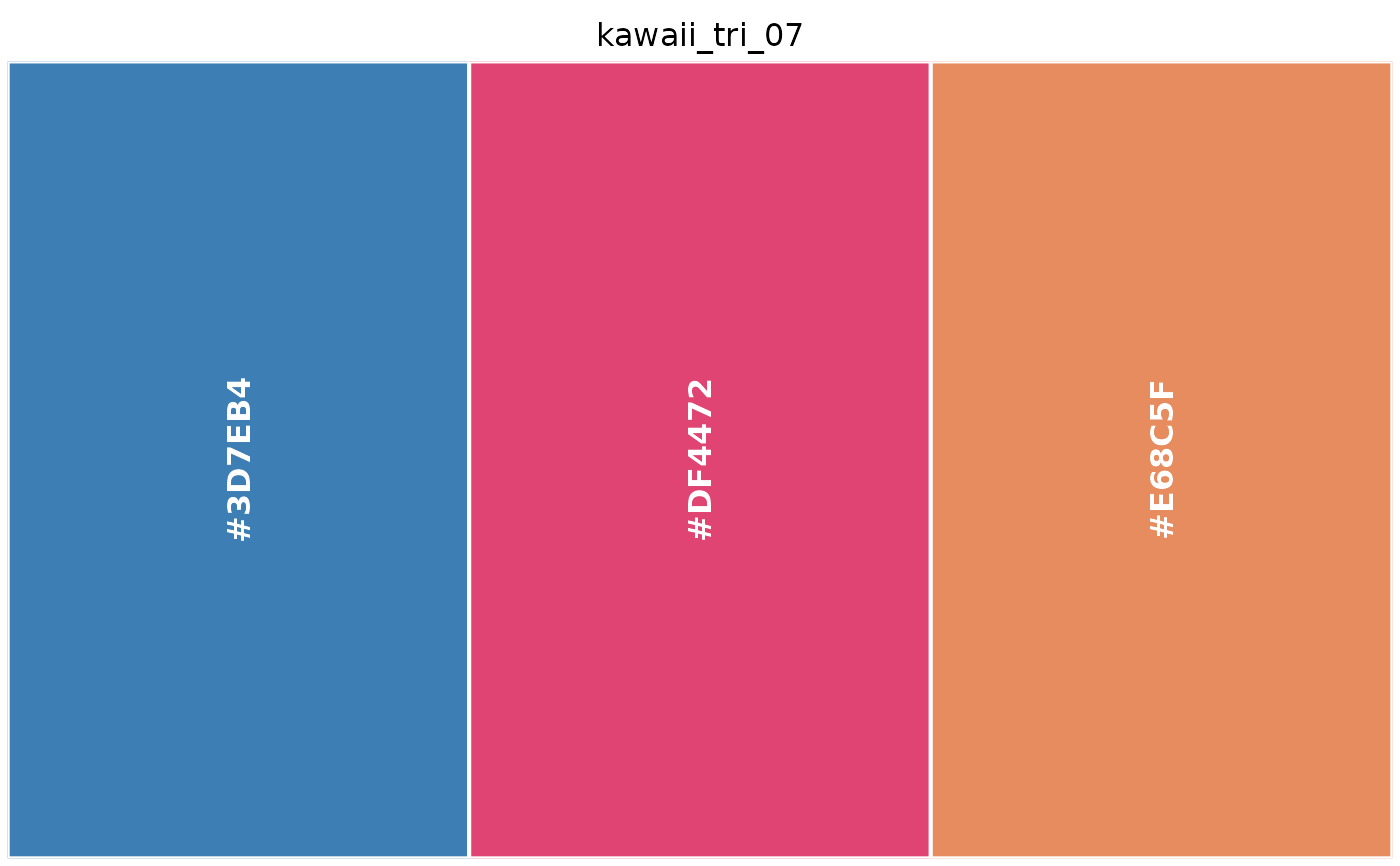
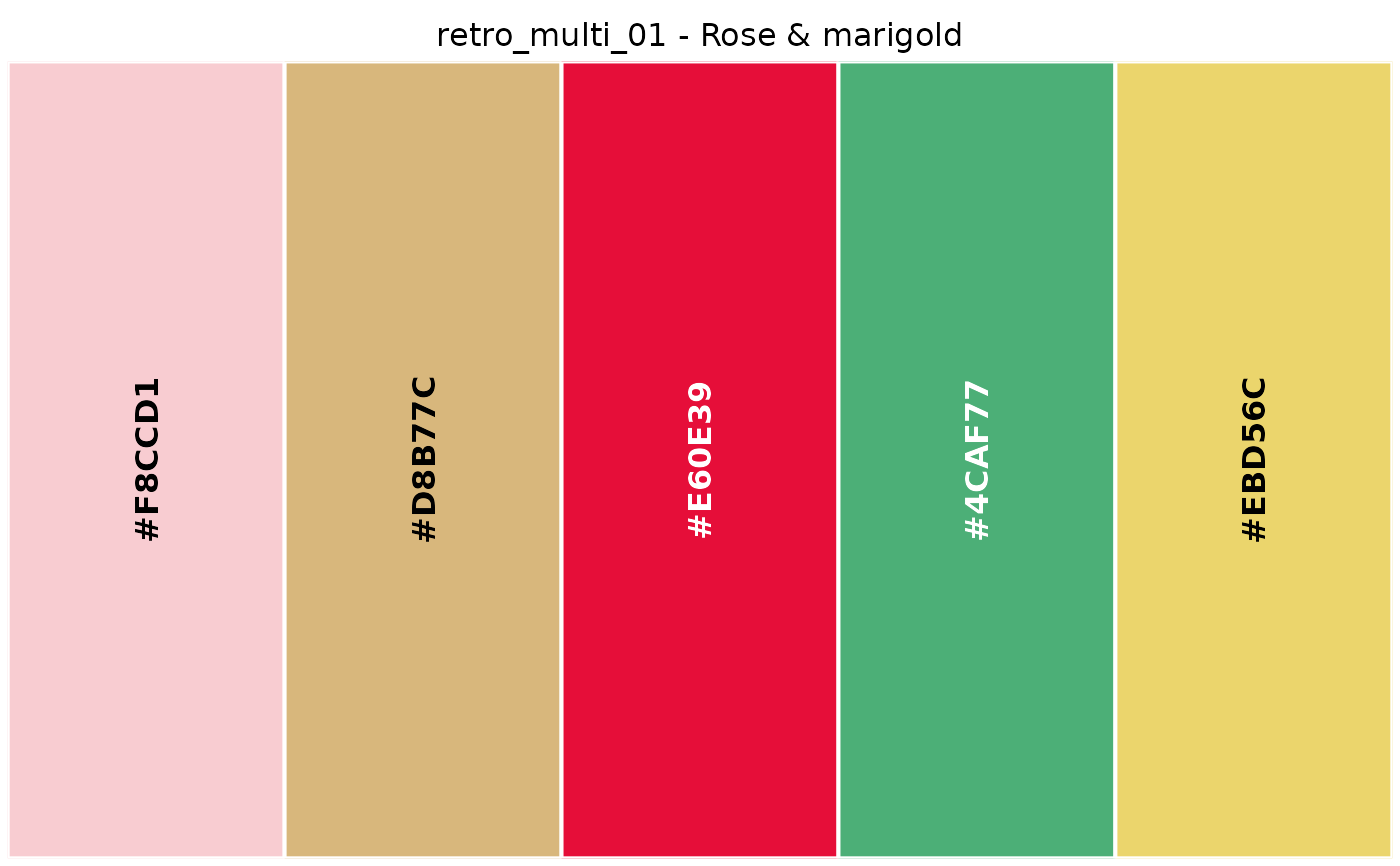
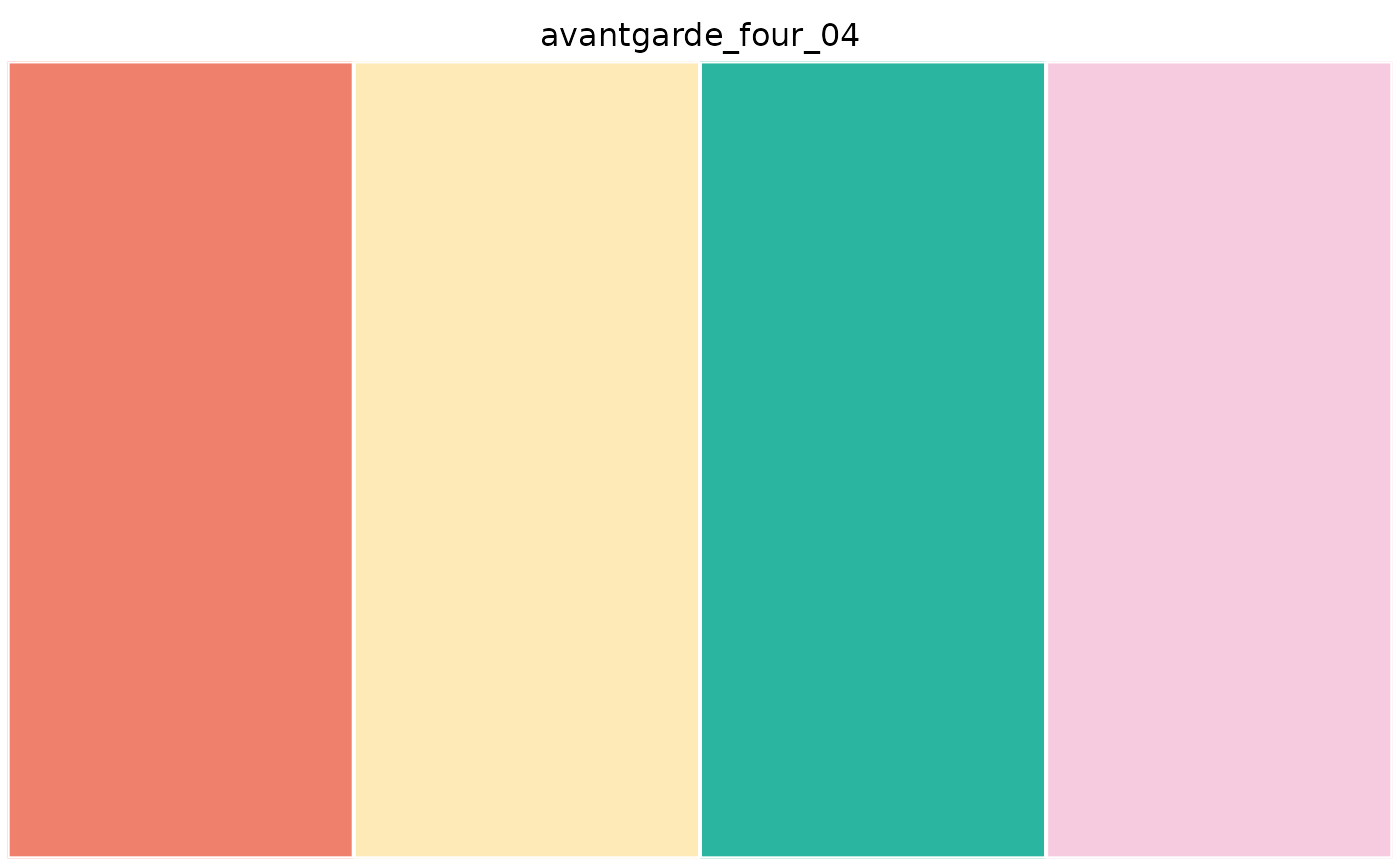
Plots a palette as a row of colour swatches, optionally labelled with the hex values. Uses base graphics, so it has no dependencies beyond R itself.
Arguments
- x
A palette object (a character vector of colours, such as
kawaii_tri_07), or a palette ID string ("kawaii_tri_07").- labels
Whether to print the hex value on each swatch.
- title
A title for the plot. By default the palette ID is used when
xis a recognised palette, and no title otherwise. UseNULLfor none.- border
Colour of the swatch borders, or
NAfor none.