A Causal Affair
-
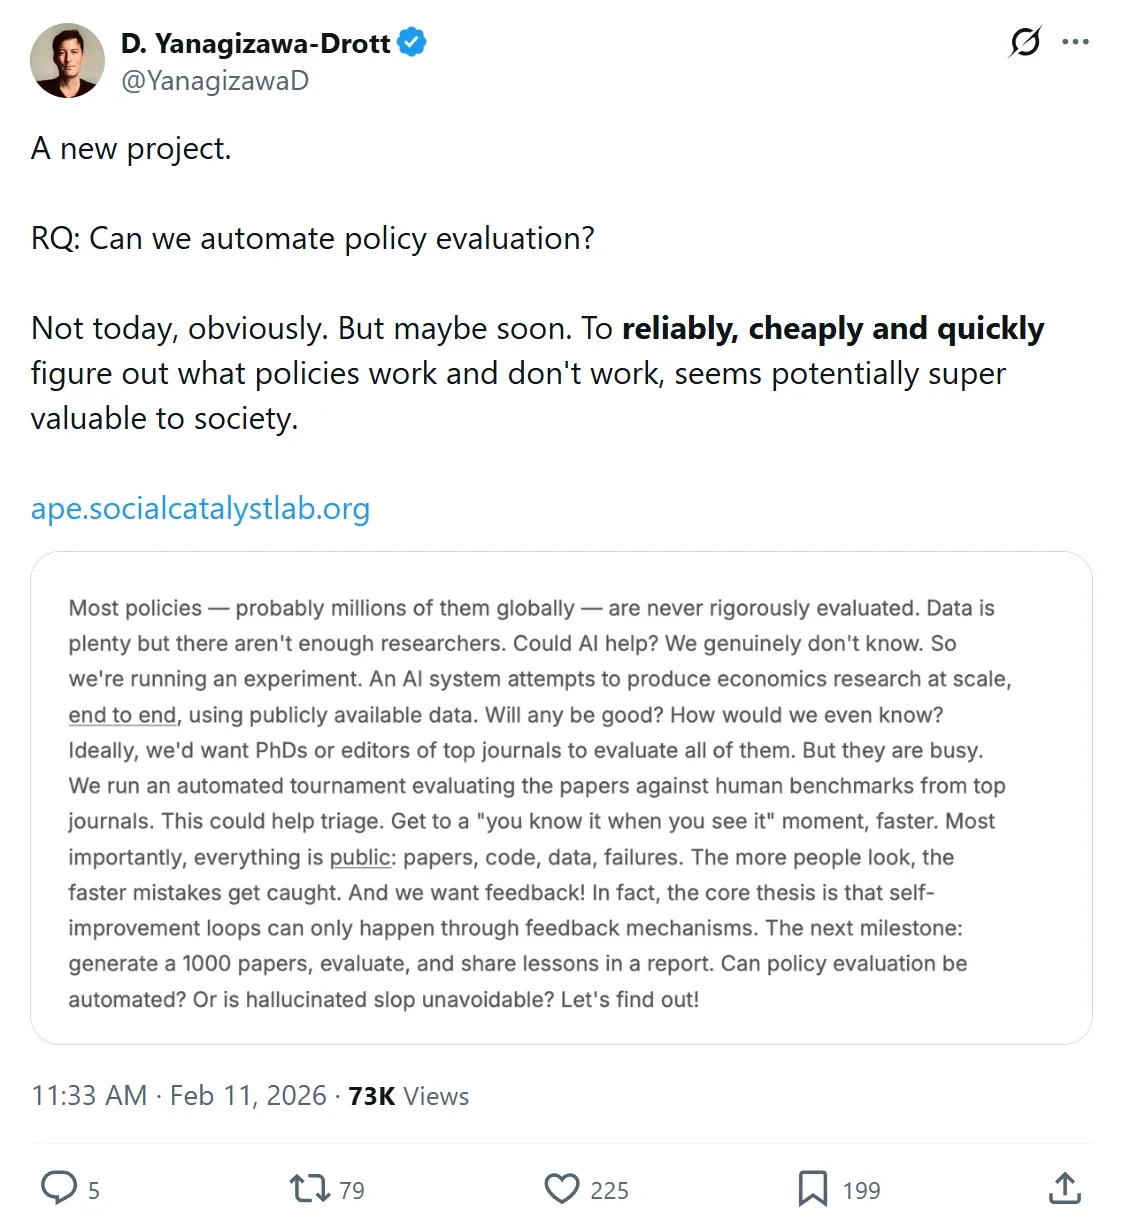
AI one-shot papers
March 21, 2026
On Twitter/X and LinkedIn, there has been a large discussion of the ability to “one-shot” policy evaluation, which David Yanagizawa-Drott has been pursuing in an interesting way: ape.socialcatalystlab.org
-
The Butlerian Jihad Was Never About the Machines
March 19, 2026
The Butlerian Jihad
-
Research in the Time of AI
March 16, 2026
Academics are worried about AI replacing them and their work. I think we spend insufficient energy appreciating how much we can expand the frontier of research thanks to this new tool. To make this concrete, I find it useful to think about research as a pipeline of stages, from ideation through publication, and to ask where AI actually changes things.
-
LLM-Friendly Academic Papers: A Proposal
March 10, 2026
This post comes from many fruitful discussions with my friend Kyle Jensen. It also benefited from helpful comments from Kyle as well.
-
Links of the Day: December 26, 2025
December 26, 2025
-
Economics Job Market Update: December 2025 - Still Very Bad
December 10, 2025
Everything is still bad. I will update some main figures now. This post provides an update to my earlier analysis of JOE posting trends with fresh data through December 10, 2025. All code and data remain publicly available on GitHub.
-
Links of the Day: December 10, 2025
December 10, 2025
-
A Survey of AI Coding Abilities
December 2, 2025
Adapted from a Yale SOM Faculty Seminar on November 19, 2025 by Kyle Jensen. Kyle is a magician and I deserve almost no credit for this post.
-
Links of the Day: November 29, 2025
November 29, 2025
- Interesting paper highlight that binning can be misspecified in panel settings - this drives misinterpretation of extreme temperature shocks.
-
Links of the Day: November 26, 2025
November 26, 2025
- Any algorithmic decision-making has both a prediction/inference AND a preference function over errors – new NBER wp highlights how preference alignment can be too narrow within a given setting
- When people see high PE ratios, they apparently predict higher stock returns – new NBER WP using experimental info treatments
-
Economics Job Market Update: November 2025 - A Historic Low
November 24, 2025
As we reach mid-November in the 2024-2025 academic hiring cycle, the data from JOE (Job Openings for Economists) paints a concerning picture: this year is shaping up to be the worst economics job market on record since at least 2015.
-
Links of the Day: November 22, 2025
November 22, 2025
- Another great blog
- How to Reproduce this Book Exactly with LaTeX - great resource for writing Latex
-
Links of the Day: November 17, 2025
November 17, 2025
- This is a great way to organize feedback - I am going to try to do this! conventionalcomments.org
-
Links of the Day: November 15, 2025
November 15, 2025
- “Candidates whose research is more similar to the committee are more likely to win” - we are just horrible at hiring in academia IMO
- Update your syllabus and stay on the frontier - it will increase your students’ wages. Epic work by my colleagues @barbarabiasi.com and @
-
Economics Literature Search Tool
November 15, 2025
I’ve been working on a side project that I think might be useful to other applied folks: a full-text search engine for econ/finance journals and NBER working papers.
-
Leniency Designs: An Operator's Manual
November 15, 2025
I just posted a draft of a new paper with the amazing Peter Hull and Michal Kolesár: Leniency Designs: An Operator’s Manual. I will post a longer summary later, but hope you’ll take a look!
-
Links of the Day: November 14, 2025
November 14, 2025
- A skydiving man captured in front of solar activity - actually real!
-
Links of the Day: November 13, 2025
November 13, 2025
- How to use LLMs in research work - a really nice introduction to coding with LLMs for research by Kohei Kawaguchi. Code and docs available in a github repo
-
Links of the Day: November 12, 2025
November 12, 2025
- Grading difference affect gender gap in STEM? - Need to dig into this but need to understand why there would be gender differences in “preference” for grades
- I’ve really enjoyed this new book by my co-author Tarun Ramadorai (and John Campbell!) - I think finance could do a better job arguing for itself as an important tool for everyone!
- You should be using Zellij instead of screen - This has been a total game changer, especially combined with Ghostty + Claude Code zellij.dev
- You should use Ghostty as your terminal if you have a Mac ghostty.org
-
Economics Job Market Tracker: Visualizing JOE Posting Trends 2015-2025
October 8, 2025
The interactive visualizations below show how the economics job market has evolved from 2015 to 2025 using data downloaded from JOE on the AEA website. This is following work done by lots of folks, most notably John Cawley’s reports on thr state of the market.
-
Contamination Bias in Linear Regressions
November 6, 2024
Economists love using linear regression to estimate treatment effects — it turns out that there are perils to this method, but also amazing perks. [-0-] [-0-] This post is a synthesis of a Twitter/Bluesky thread.
-
Reader's Digest of Optimal Monetary Policy in Production Networks
November 6, 2024
Editors Note: This summmary was created using Claude AI. Please send me any comments or corrections.
-
Reader's Digest of Spatial Unit Roots and Spurious Regression
November 6, 2024
Editors Note: This summmary was created using Claude AI. Please send me any comments or corrections.
-
Testing out a new format: Reader's Digest of Econometrica Papers [Economic Theory Paper]
November 6, 2024
Ben Golub had the idea of summarizing technical papers (such as in Econometrica) using AI to be more easily approached by non-technical economists. These papers were selected from the list of the most prominent recent papers in Econometrica by Google Scholar. This is the second post, for an economic theory paper. I also posted one for an econometrics paper.
-
Testing out a new format: Reader's Digest of Econometrica Papers [Econometrics Paper]
November 6, 2024
Ben Golub had the idea of summarizing technical papers (such as in Econometrica) using AI to be more easily approached by non-technical economists. These papers were selected from the list of the most prominent recent papers in Econometrica by Google Scholar. First, an econometrics paper. I will also post one for a theory paper.
-
Using AI in Research and Teaching: A Practical Guide
June 24, 2024
[N.B. I gave a version of this post for an internal discussion at SOM. I’ve modified it for general consumption. Many of the examples I walked through live – I will try to add videos for those, in the future, but for now they will just sit as “examples” in the text.]
-
Presidential Lectures
November 23, 2023
I wanted to put together a list of AEA (and other Economics groups) Presidential speeches for my own perusal. I thought I’d share it here in case it’s useful for others.
-
Gary Chamberlain Lecture Notes from Harvard's Econ 2120 Course
May 27, 2021
Gary Chamberlain’s family granted approval for me to post the collected set of lecture notes from the late Gary Chamberlain’s 2010 Econometrics class (EC2120) that I took during my economics Ph.D. at Harvard University. Gary was a remarkable teacher and this class was an amazing experience for me as a young economist. I hope you find these lectures as enthralling as I did!
-
Beamer Tips
April 30, 2018
I recently wrote up some tips and tricks for beamer. You can find the slides here and the source code on Github.
-
Best Figures from Economics Papers
March 12, 2018
Matt Notowidigdo prompted a great thread of peoples’ suggestions of their favorite figures. I thought I would give a resting place for the nominees:
-
Stata Maps
July 9, 2017
I recently put together a maptile geography to incorporate the NPR hex tile map for state maps to be used in Michael Stepner’s excellent Stata maptile ado program (which is a wrapper for spmap). It should be up soon on Michael’s website, but you can grab it here for now.
-
Comparing tidyverse R to Stata
July 9, 2017
I spent some time this weekend learning
tidyverse, a set of R libraries inspired by tidyr by Hadley Wickham. I have a lot of friends who swear by R – I used it in college quite a bit, but once I switched to Stata I never went back. The main reason for this was that the base R language (which is how I learned R) is quite clunky – it’s painful to do basic data cleaning. However, I recently read through a nice post by David Robinson on the values of tidyverse and I decided to give a shot.